Qubitro as a Device and Data Management System
Besides the device management integrations, Qubitro allows you to store, process, and transform data on the fly. This is a useful feature when you have different data sources, devices, and data formats. Qubitro offers the following types of functions:
Managing Device Connections with Qubitro
Qubitro supports two ways to manage devices: connect directly to Qubitro or integrate external device platforms.
Connecting Devices Directly
- Using MQTT
- Use any programming language and MQTT library (Examples available here)
- Using HTTP
- Send JSON data via HTTP POST requests (Instructions available here)
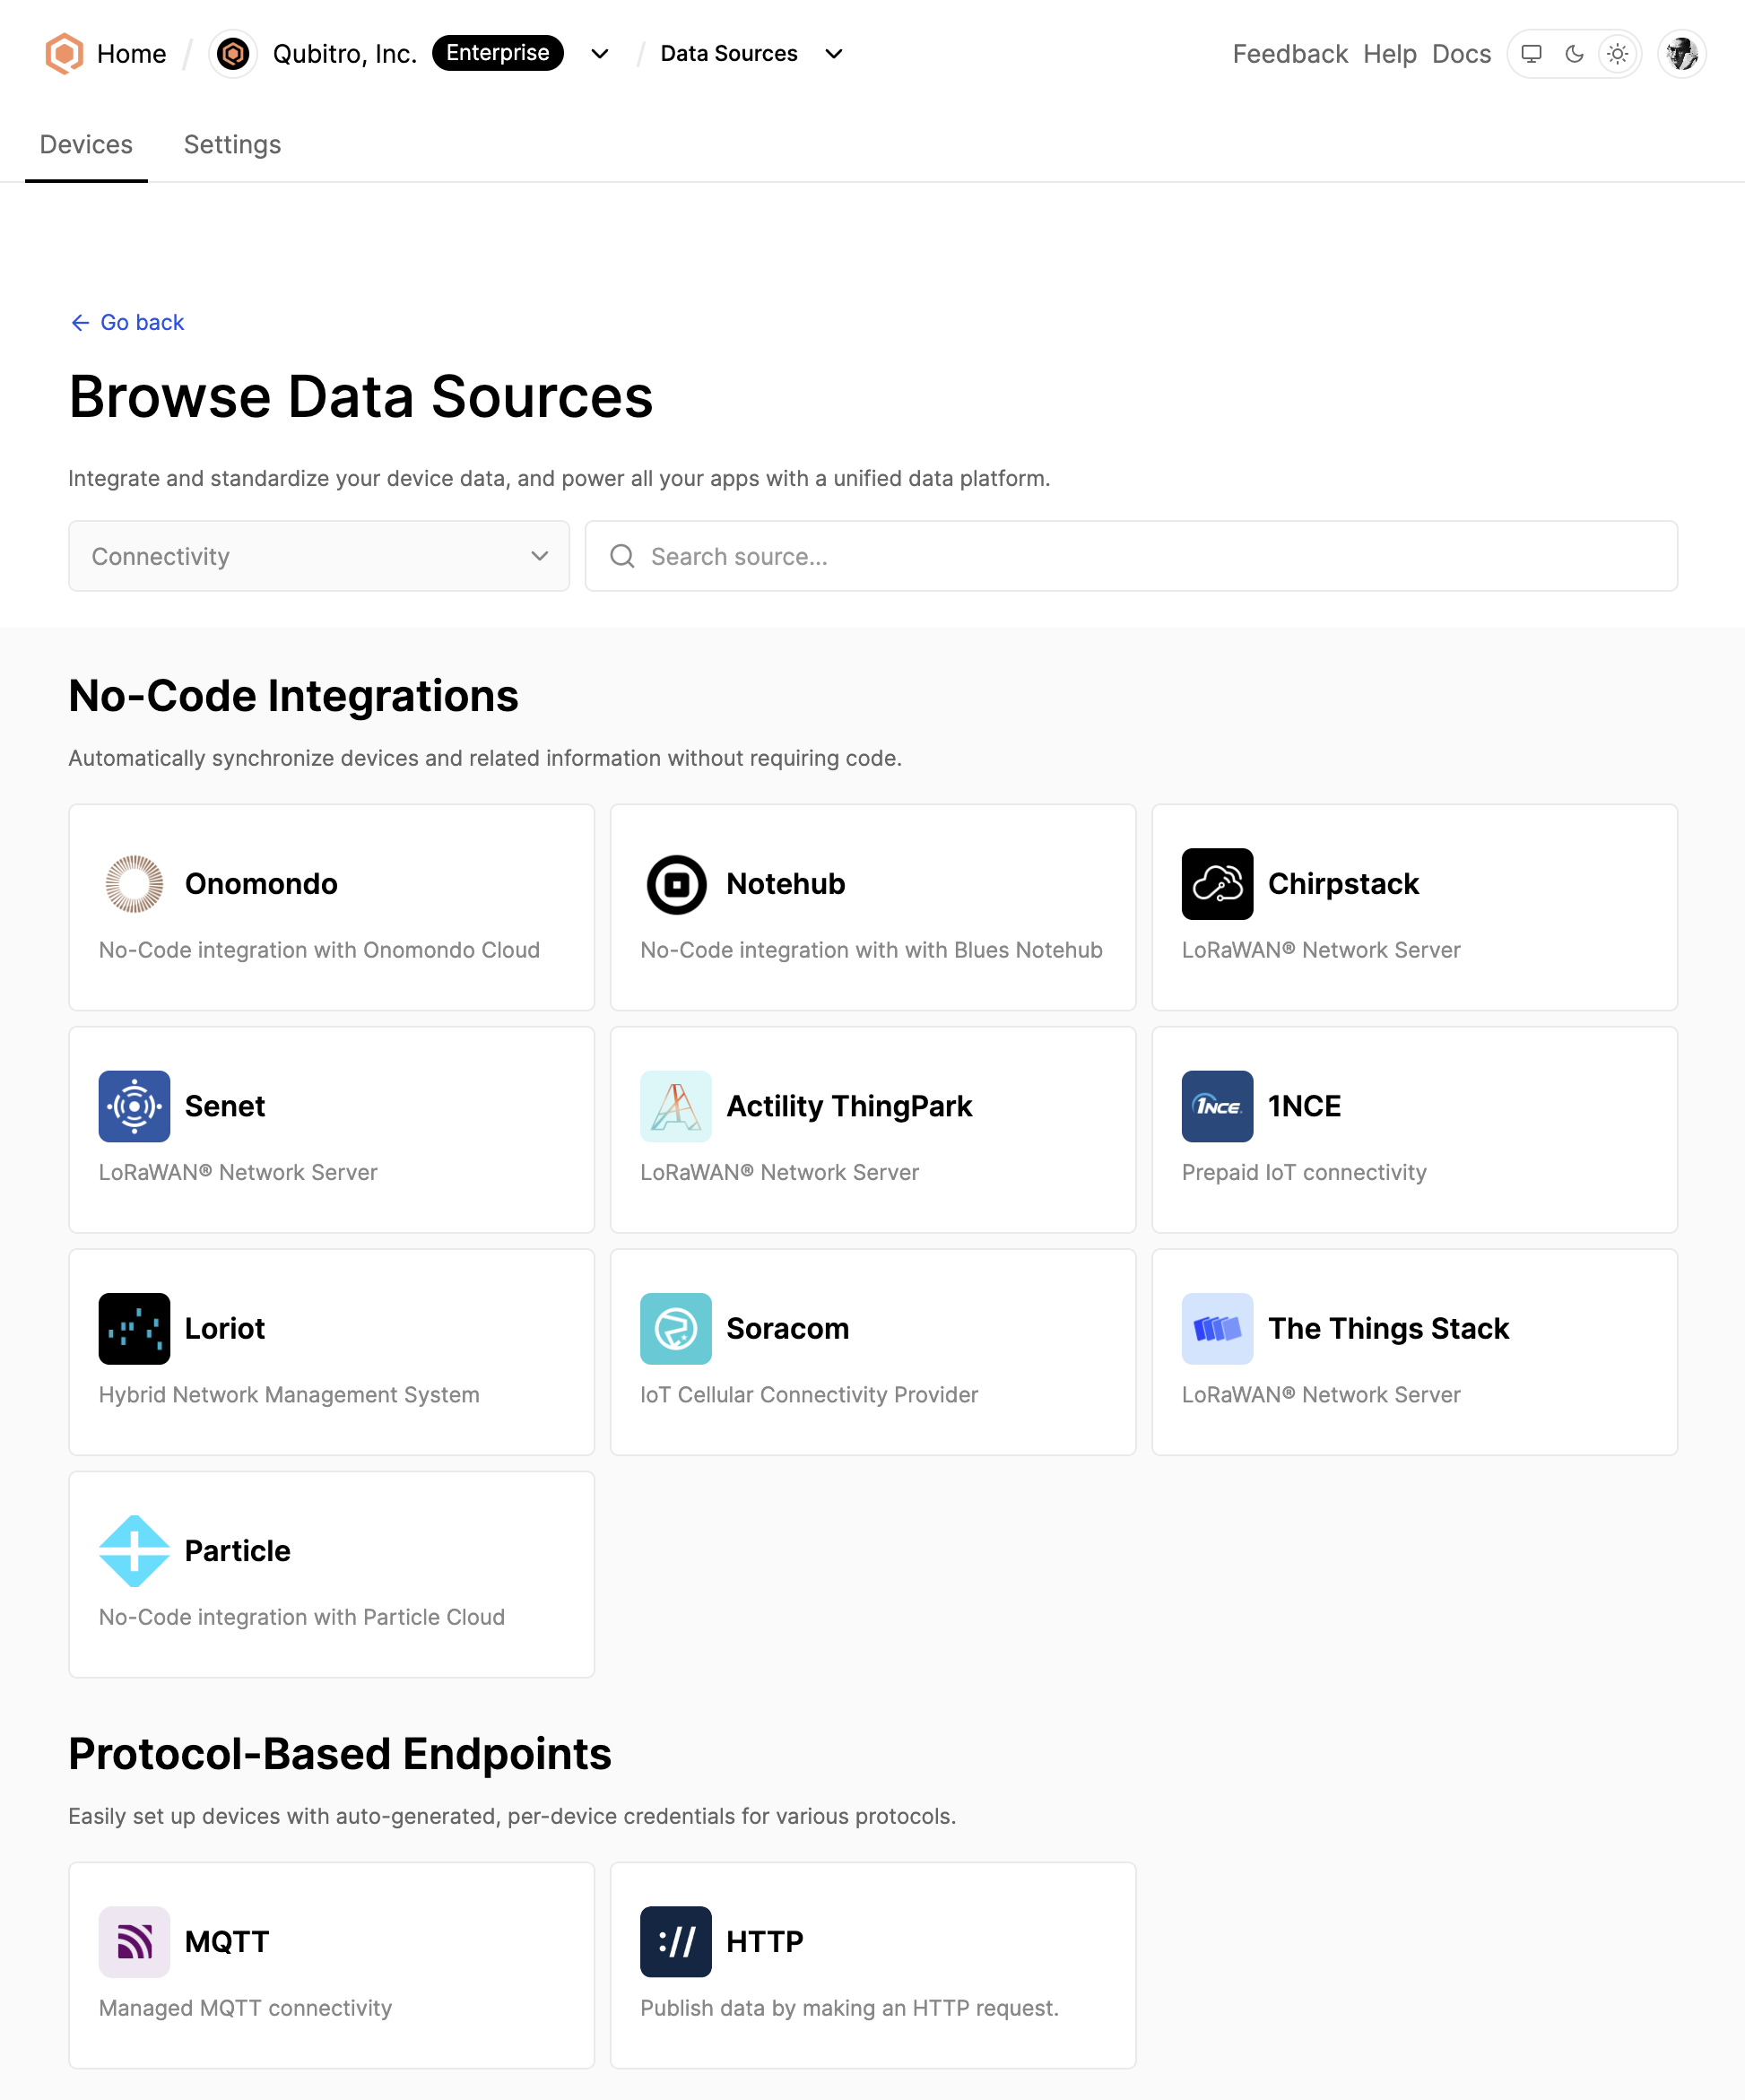
Integrating External Platforms
You can connect to external brokers, network servers, and cellular platforms, with integrations including Onomondo, Notehub, The Things Stack, Particle, 1NCE, and more.
Qubitro also offers custom and private integrations for enterprise-grade customers.
 Qubitro Data Sources
Why Use Grafana for Showing IoT Data?
Grafana is a versatile choice for visualizing and analyzing various types of data. With Grafana, you can visualize data with various types like graphs and tables, customize extensively, centralize multiple data sources, create and customize queries, and manage alerts and notifications.
Qubitro already supports highly customizable dashboards and alerts with Functions. However, for specific cases where you need to work with Grafana, it offers great flexibility to use Qubitro for its data sources and storage, preventing repetitive work in Grafana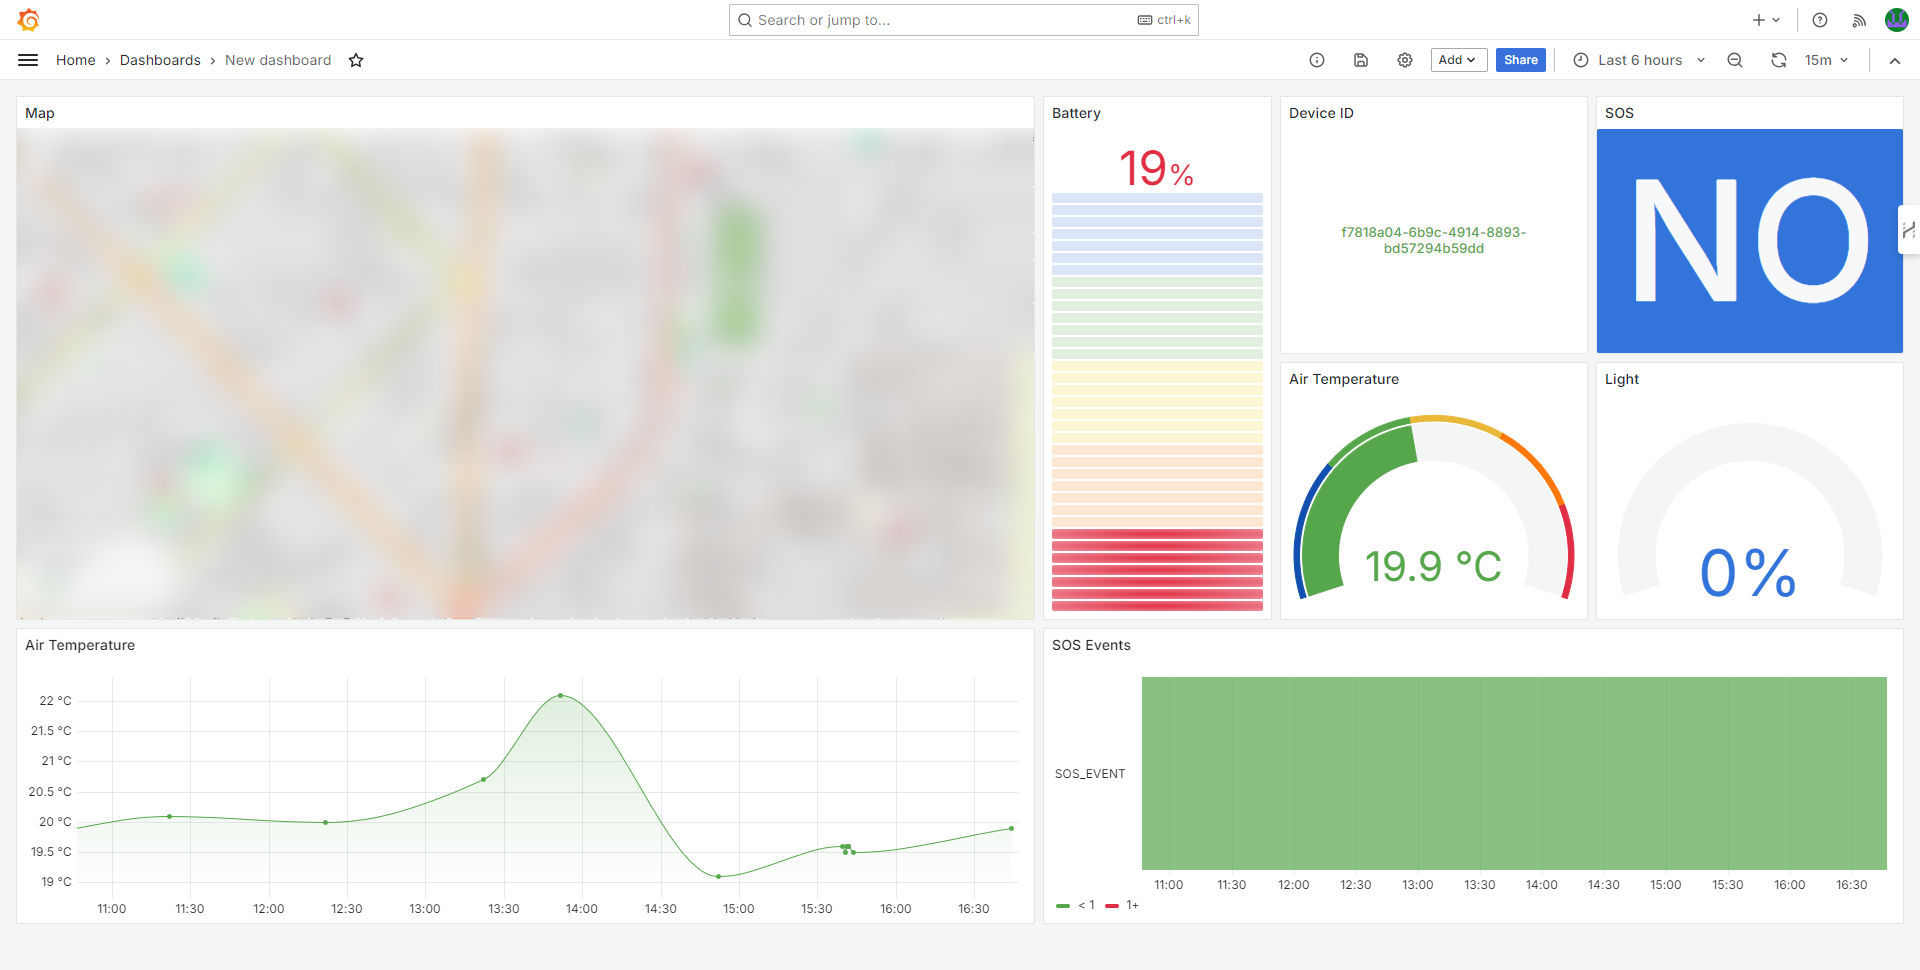 Figure 20 - Finished Dashboard in Grafana
Now, let’s see how to connect Qubitro and Grafana.
Connecting Qubitro and Grafana
In this section, we will create both accounts and connect the platforms.
Creating the Accounts
For integrating both services, you need to create both accounts if you don’t have them yet.
- Visit Qubitro Signup to create an account. Note that you can start using Qubitro for free, but APIs are only available in the Scale and Enterprise plan.
- Go to Grafana Signup to create an account in Grafana and launch an instance of the Grafana Cloud Service. Grafana also offers a free account that you can use to experiment.
Exploring the Qubitro API
Qubitro's REST APIs allows IoT developers to interact with Qubitro services using HTTP requests. With APIs, you can build custom IoT applications, manage device data, and integrate platforms easily.
Let’s take a look at the structure of the API:
- The API of Qubitro is accessible at
https://api.qubitro.com/<LATEST_VERSION>, following the REST architecture. - An API key in the HTTP header must be used for authentication purposes. The format of the header is as follows:
Authorization: Bearer <API_KEY>. - The API supports GET, POST, PUT, and DELETE HTTP methods, depending on the type of action you want to execute.
Example cURL command:
jscurl --location --request GET 'https://api.qubitro.com/v2/projects/<PROJECT_ID>/devices/<DEVICE_ID>/data?page=1&limit=25&range=all&keys=key1,key2,key3' \
--header 'Authorization: Bearer <API_KEY>'
Example response:
json{
  "success": true,
  "action": "get device data",
  "status": 200,
  "message": "Device data fetched successfully.",
  "data": [
    {
      "humidity": 82.5,
      "motionDetected": true,
      "temperature": 29.09,
      "time": "2024-07-15T10:56:51.642023Z"
    },
    {
      "humidity": 69.21,
      "motionDetected": false,
      "temperature": 4.52,
      "time": "2024-07-15T10:56:46.639297Z"
    }
  ]
}
To see the full API documentation, visit Qubitro API Docs.
Generating a New API Key
API keys are unique codes that can be created and controlled in the Credentials section found on the main page of the Qubitro Portal.
To generate an API key, navigate to the Credentials tab and select API Keys (see Figure 3).
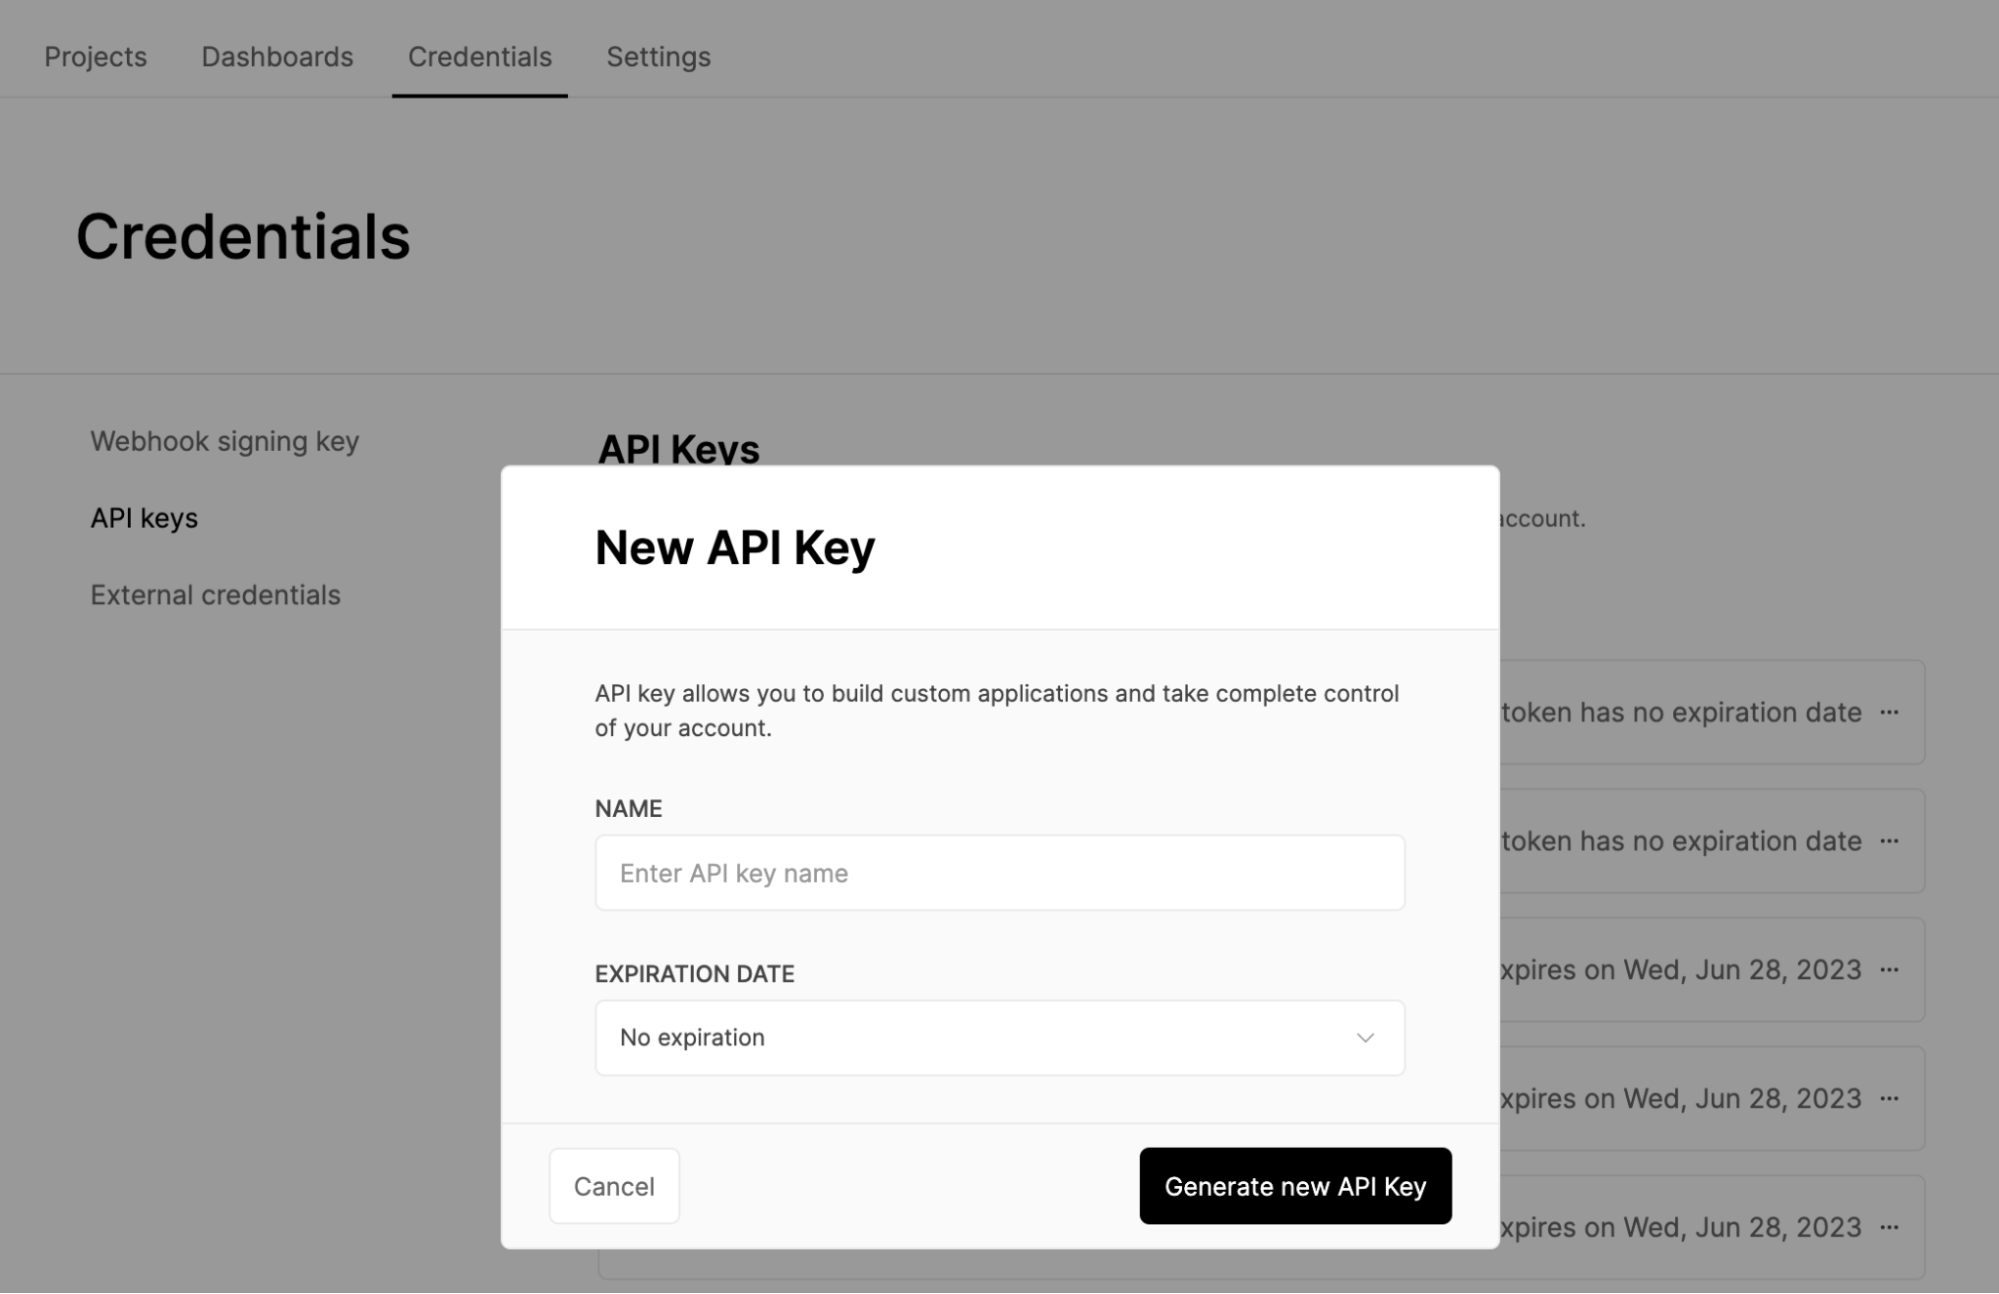 Figure 3 - Creating a New API Key
Next, you can input a clear name for the API Key, set an expiration date, and click on the option to create a new API Key. Now that you have an API key, you can integrate Qubitro and Grafana.
Adding Qubitro as a Data Source in Grafana
To be able to show Qubitro’s data in Grafana, we will use the Infinity Grafana plugin. You can reach this plugin at Grafana Plugins. This versatile plugin lets you visualize data from JSON, CSV, XML, GraphQL, and HTML endpoints.
The Infinity plugin is not included by default in Grafana. However, you can install it easily in the Grafana Cloud Service.
To install the Infinity plugin follow these simple steps:
- Login to your Grafana account and launch your Grafana stack. See Figure 4.
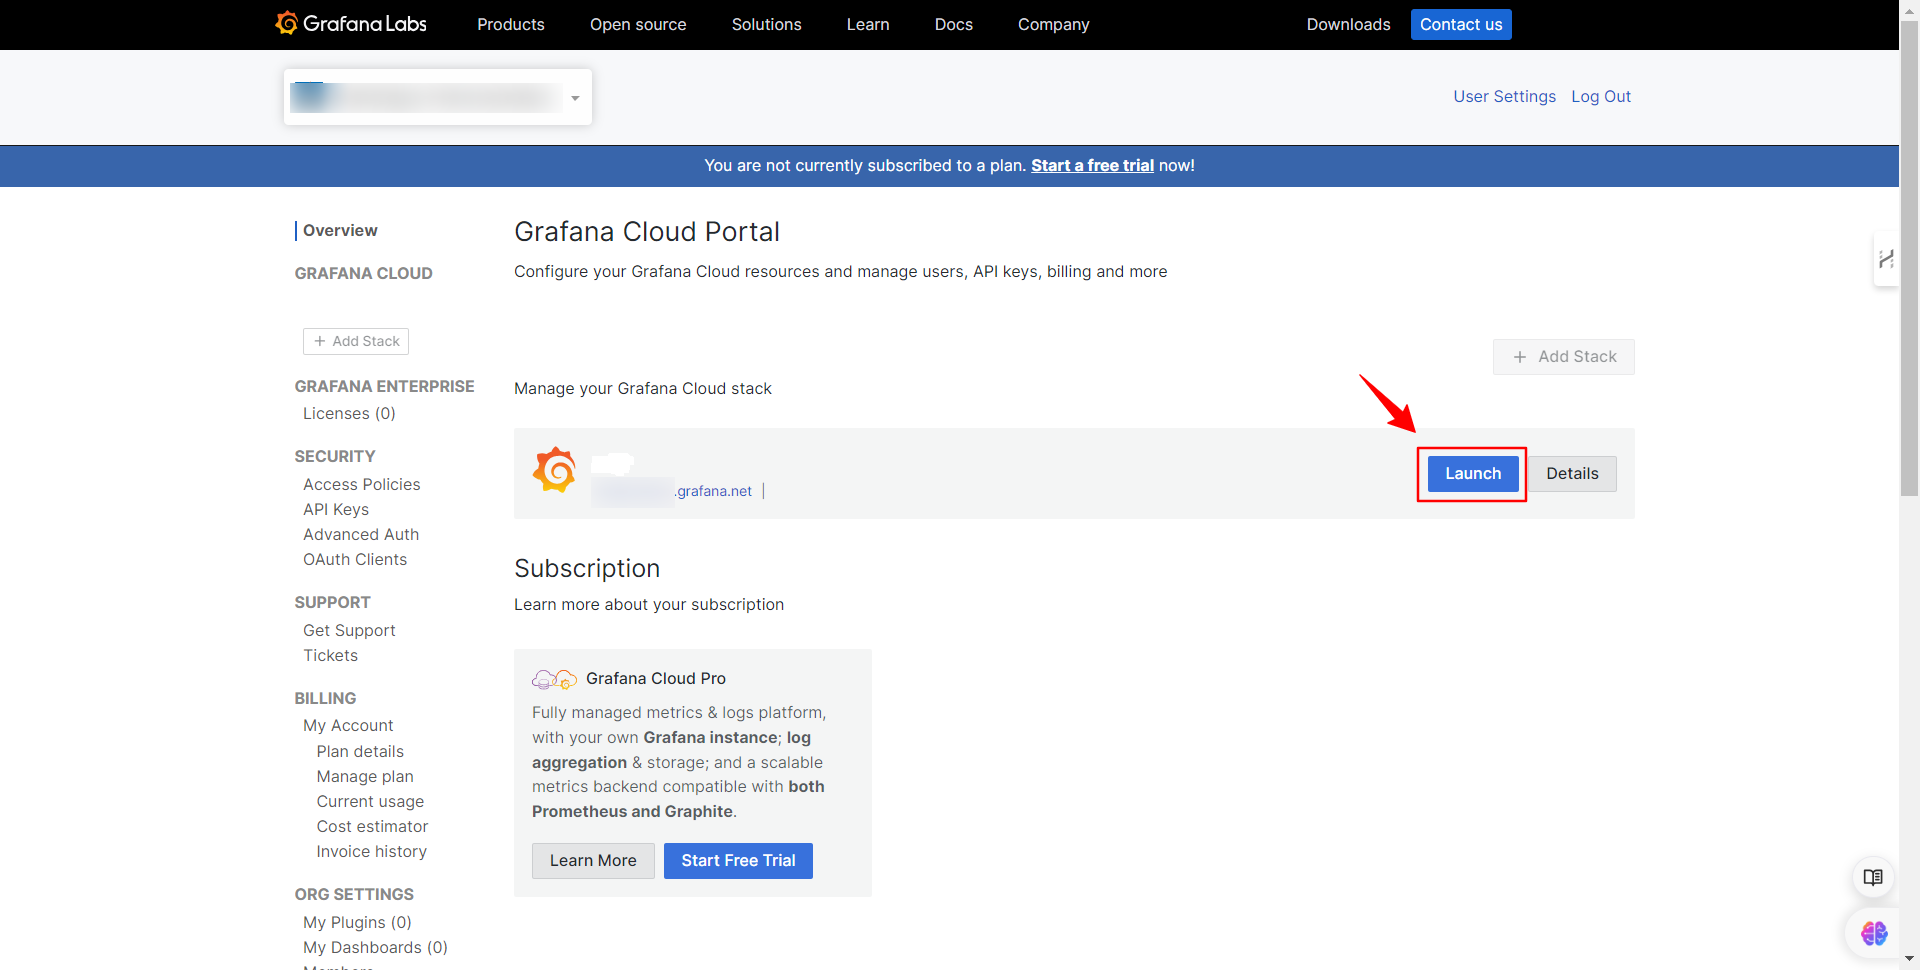 Figure 4 - Launching the Grafana Stack
 - Launch your Grafana instance. See Figure 5.
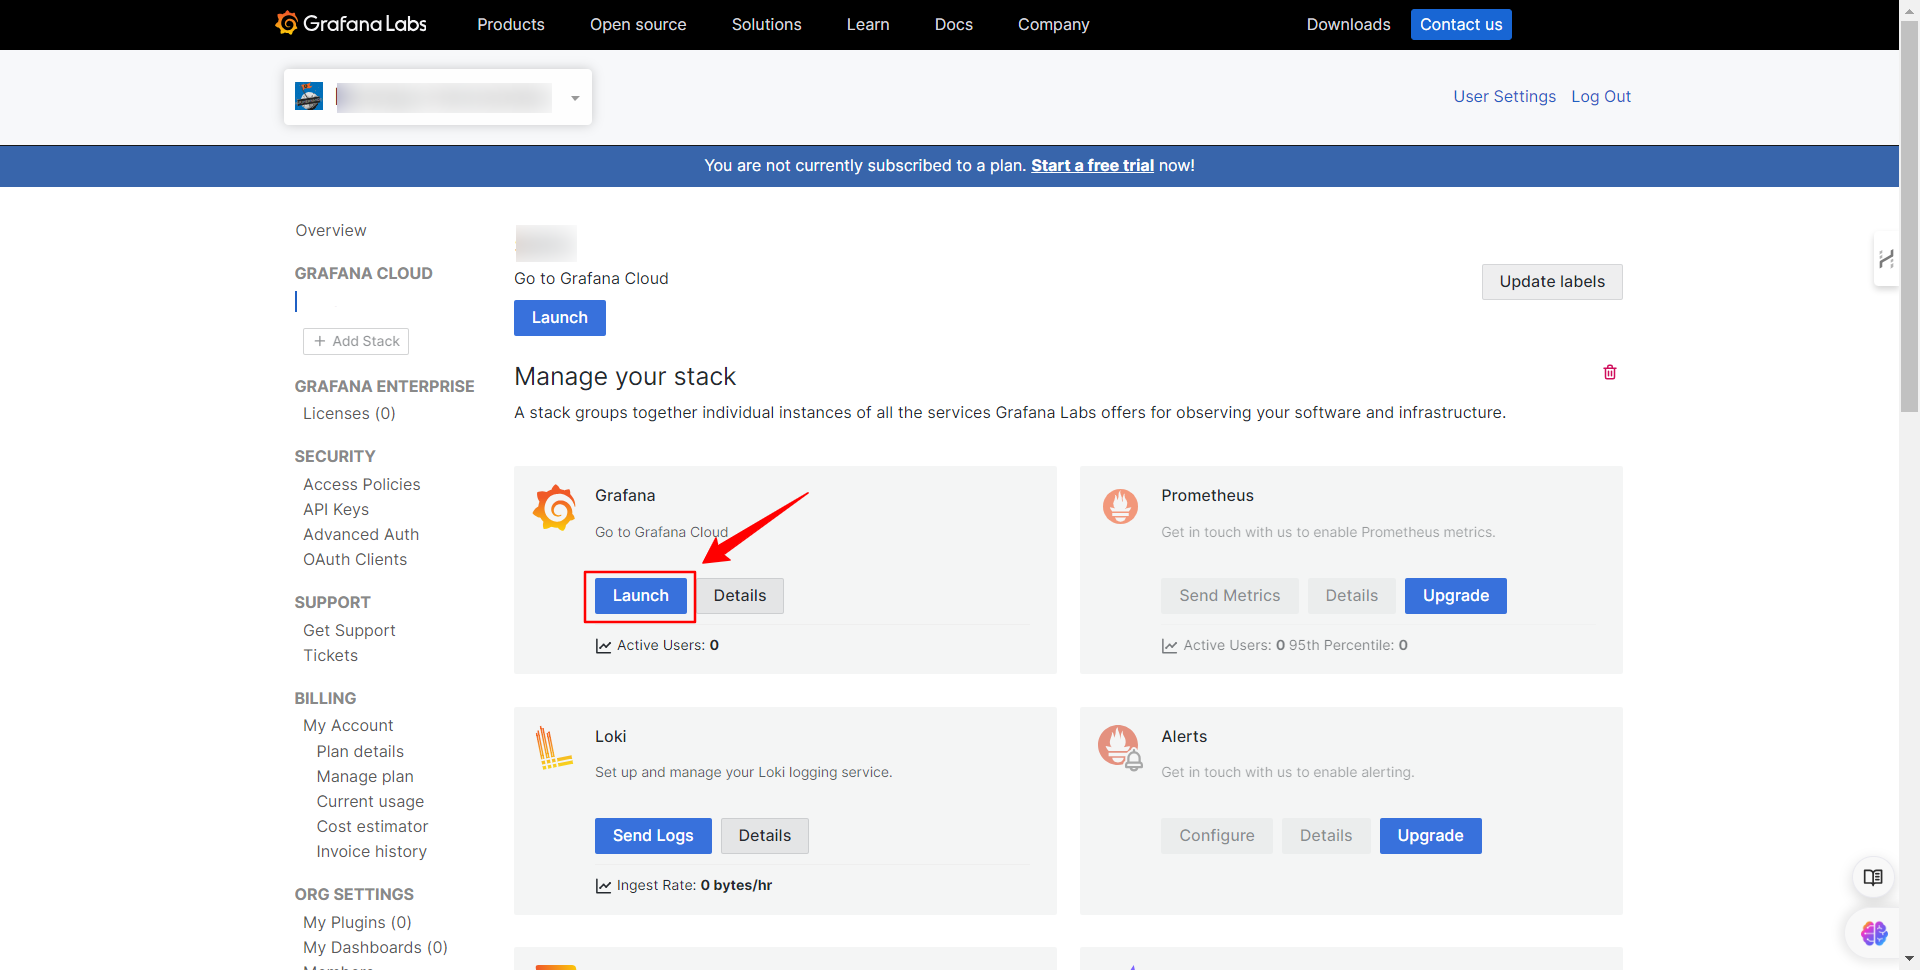 Figure 5 - Launching the Grafana Instance
 - Enter Grafana and go to the plugin section, as shown in Figure 6. Search for the Infinity plugin and click on it.
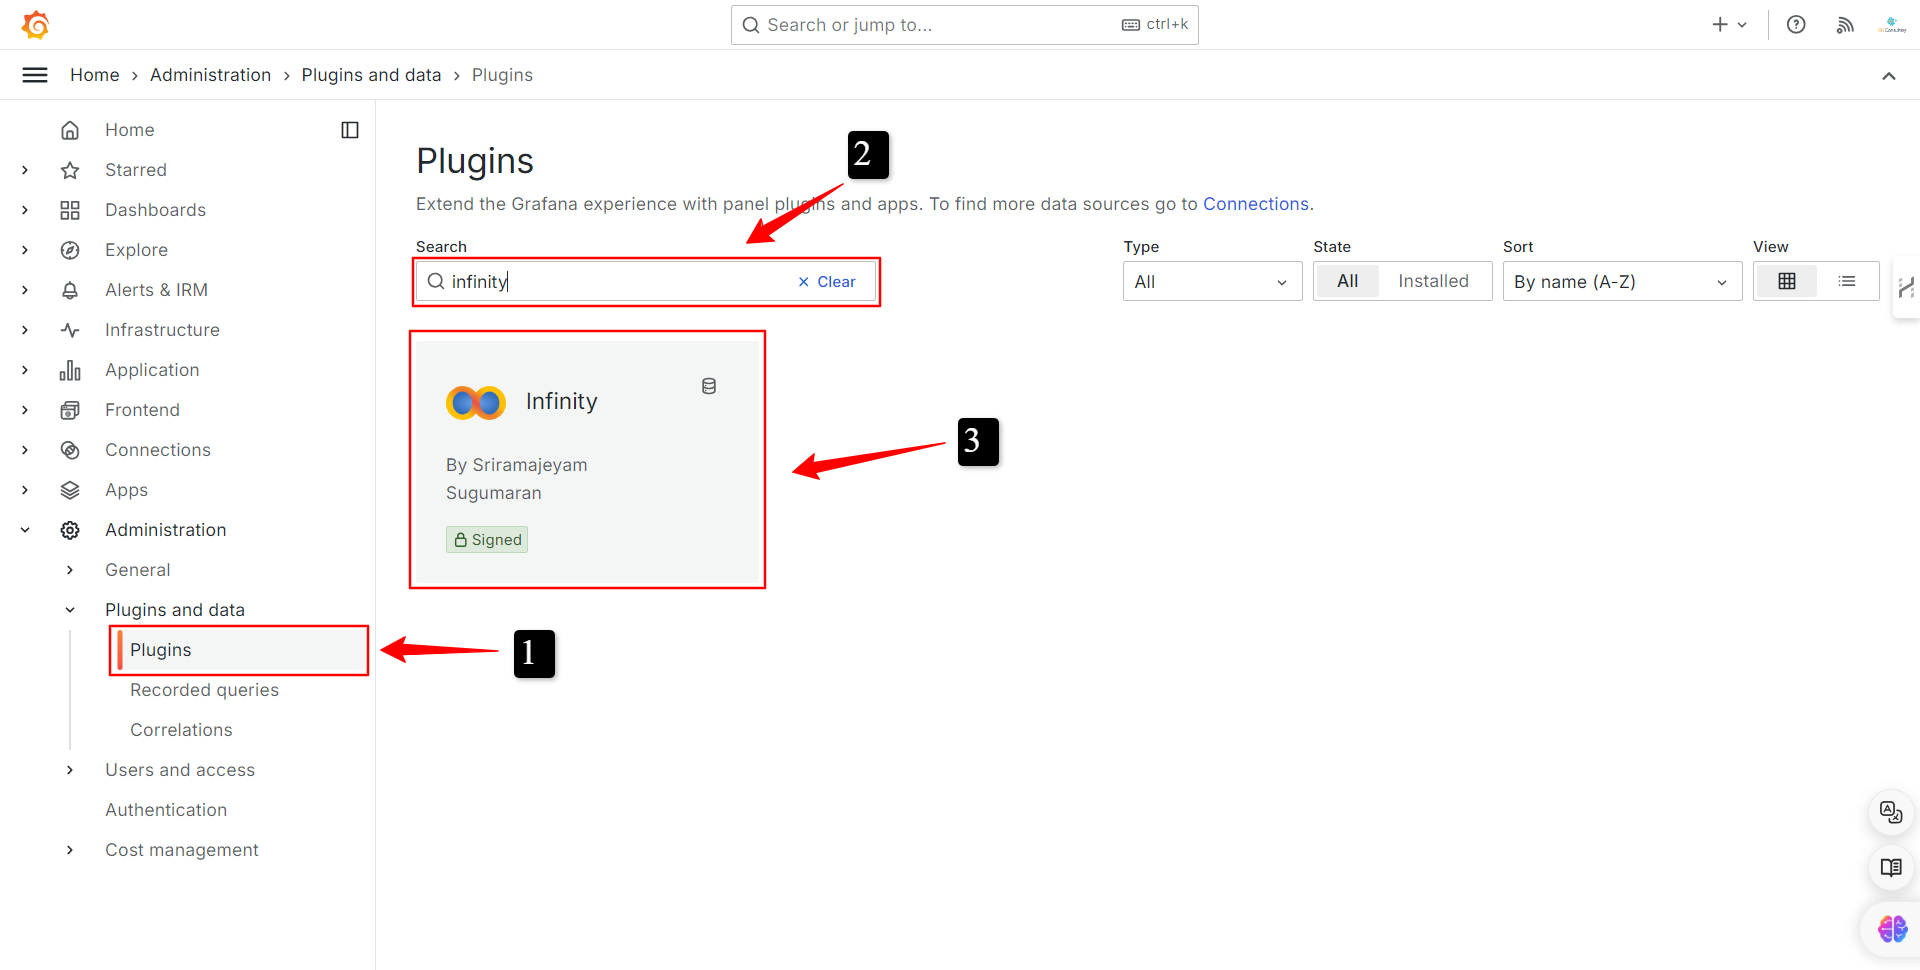 Figure 6 - Search for the Infinity Plugin
 - On the plugin page, click on the button to install it. See Figure 7. Once installed, refresh the page.
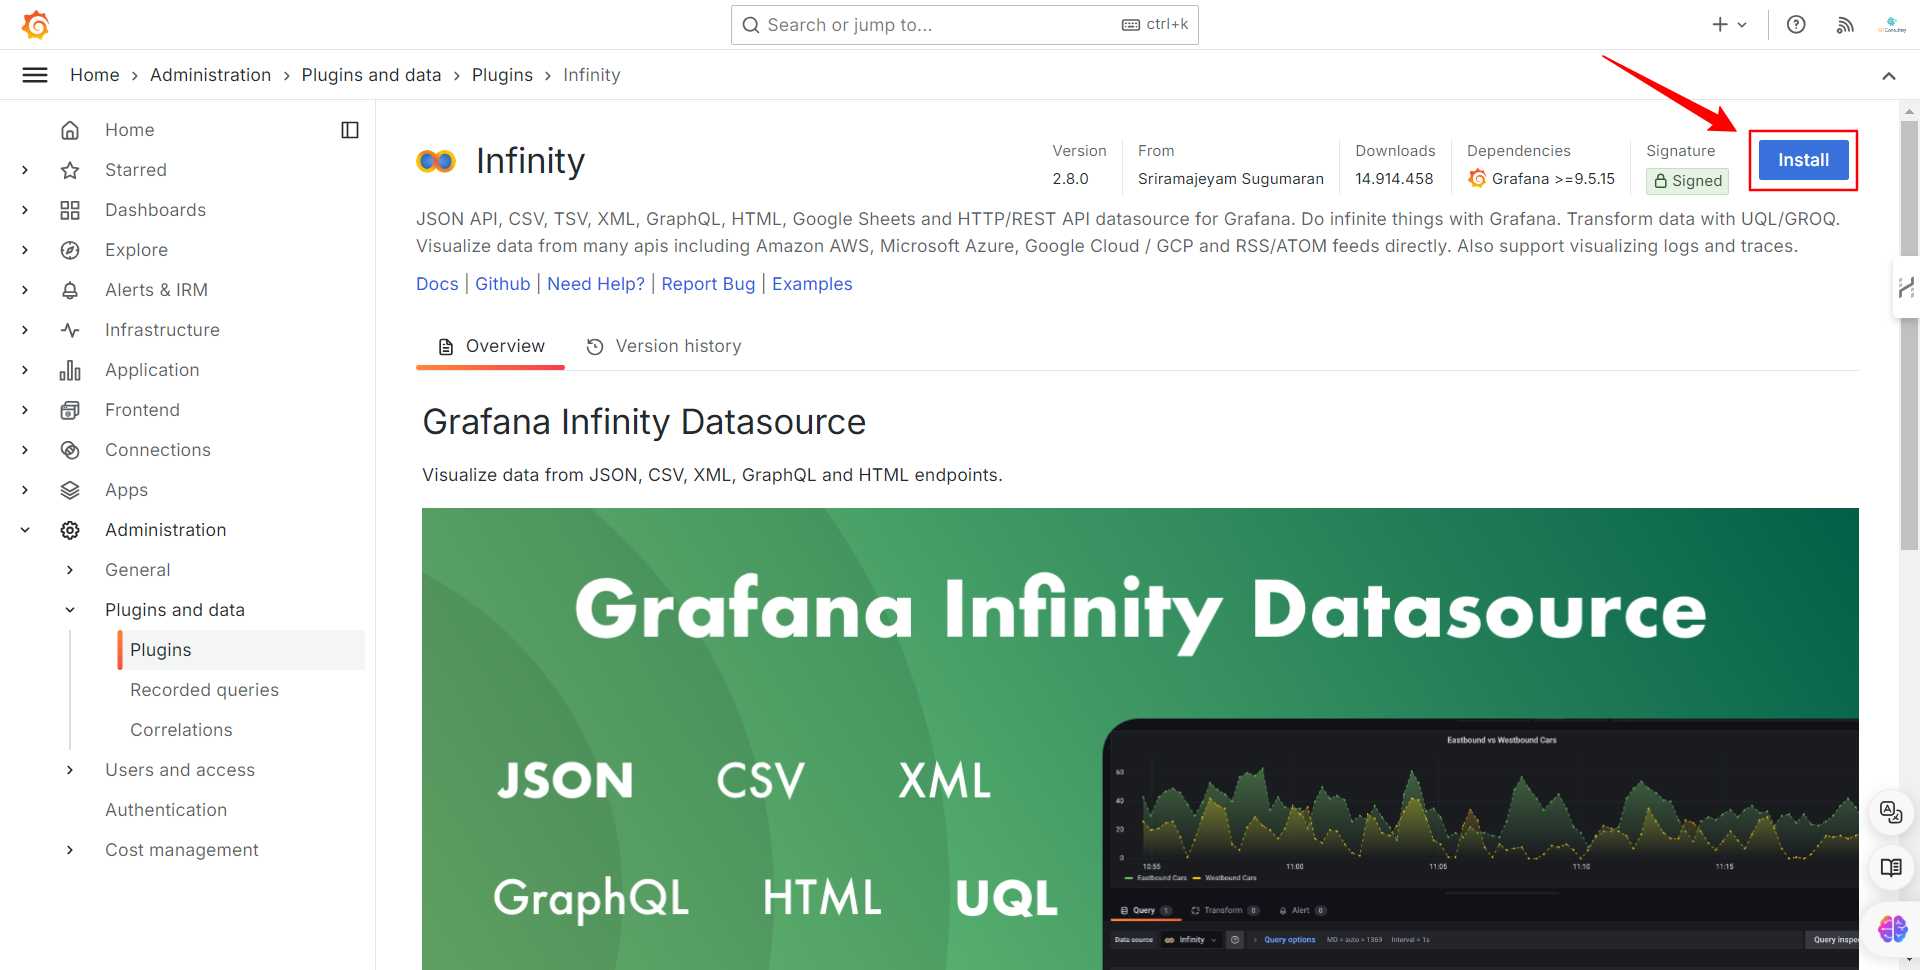 Figure 7 - Installing the Infinity Plugin
 - Now click on the “Add new data source” button to create a new data source based on the Infinity plugin. See Figure 8.
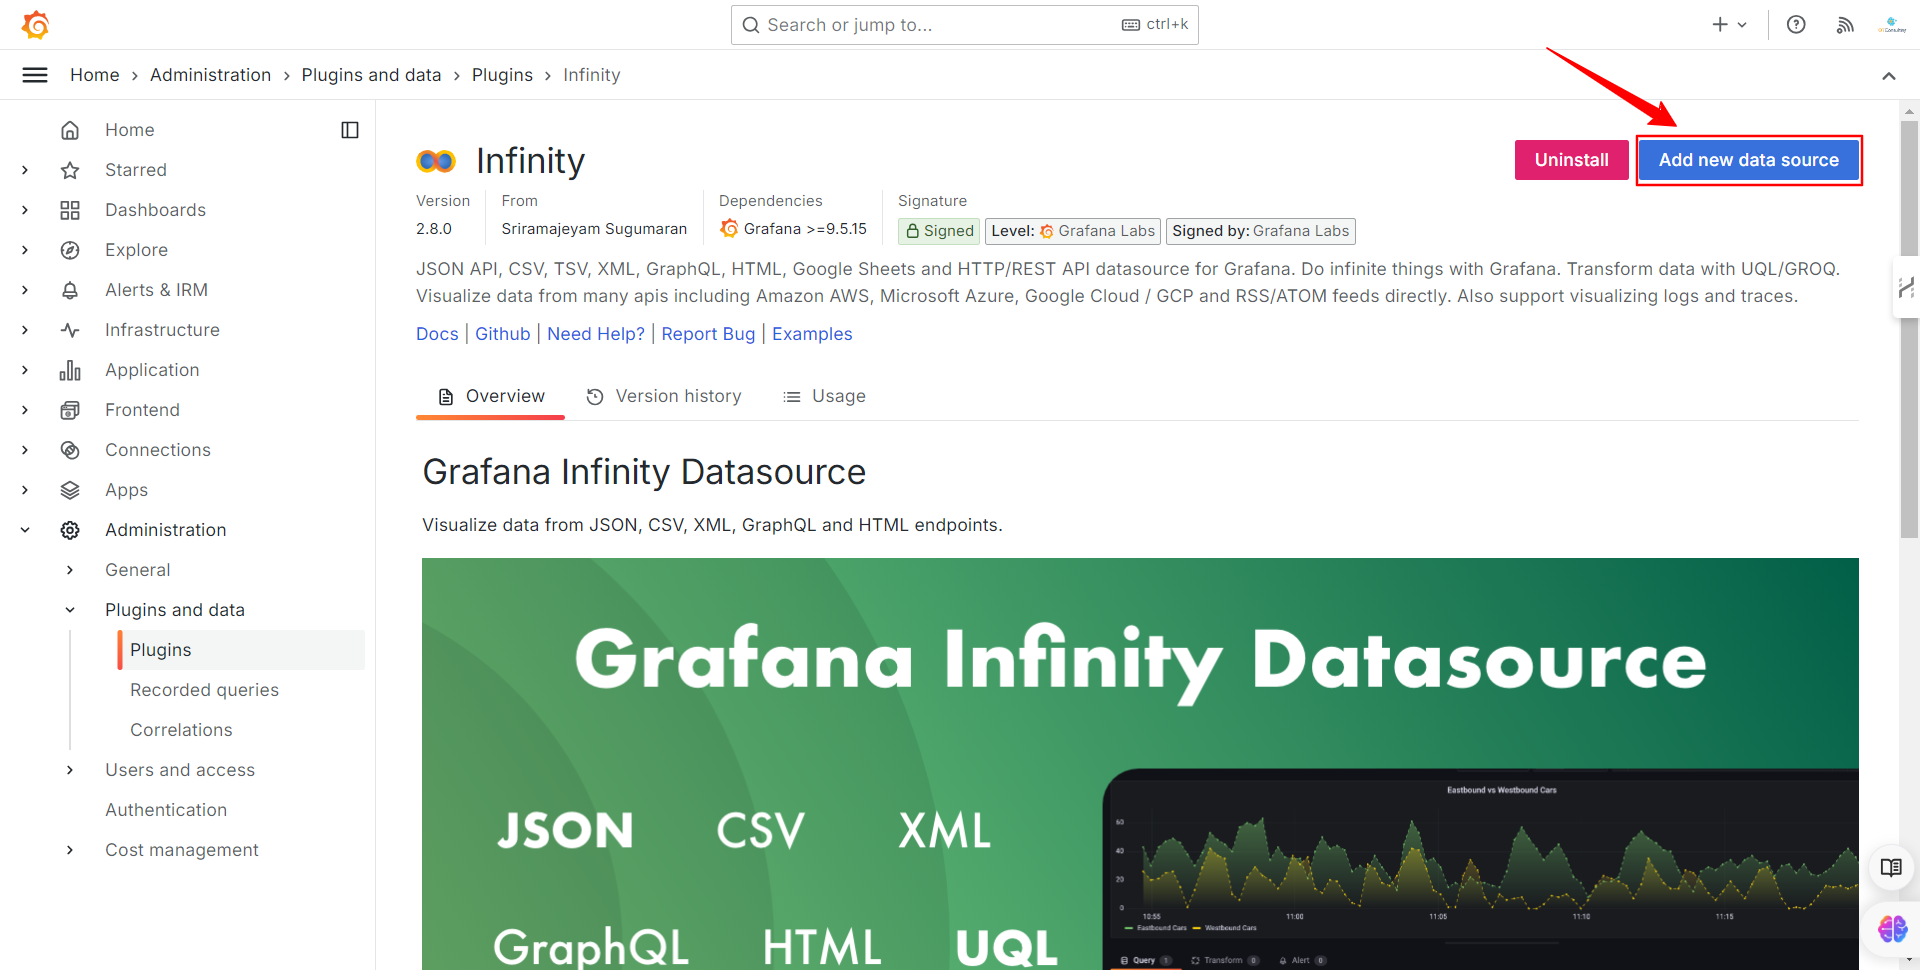 Figure 8 - Create a New Data Source
The previous step will lead you to the configuration page of the data source. Follow these steps:
- A name for the data source.
- Select the Authentication section.
- Select Bearer Token.
- Ingress the API key you generated.
- Enter the base URL of the Qubitro API.
- Save and apply.
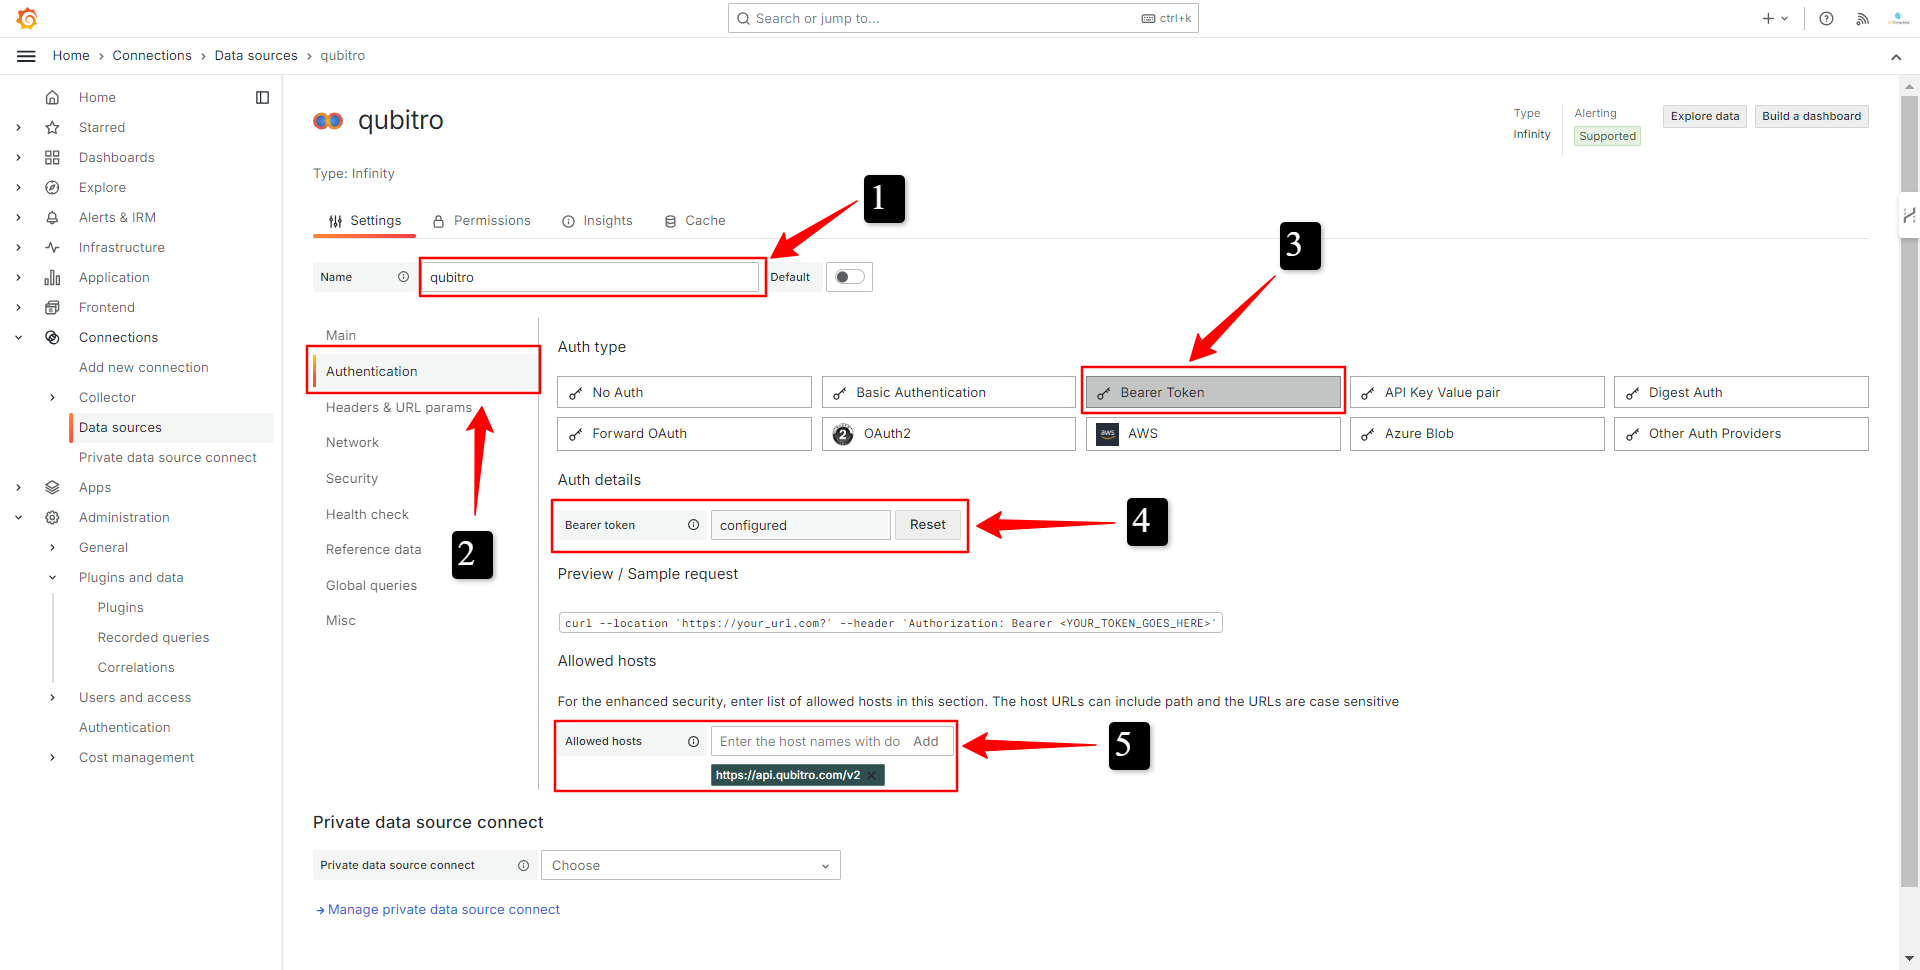 Figure 9 - Configuring the Data Source
By following these steps you have configured the Infinity plugin as a Qubitro data source. Now, let´s see how you can build a dashboard with it.
Building a Dashboard in Grafana
In this section, we will see how to create queries in Quitro to get data from it and show it in a dashboard.
Obtaining Project ID and Device ID from Qubitro
Before we can get data from Qubitro, we need to get some information.
Follow these steps to obtain the project ID and the device ID:
- Enter to Qubitro and go to the projects page. Click on the project you want to use. See Figure 10.
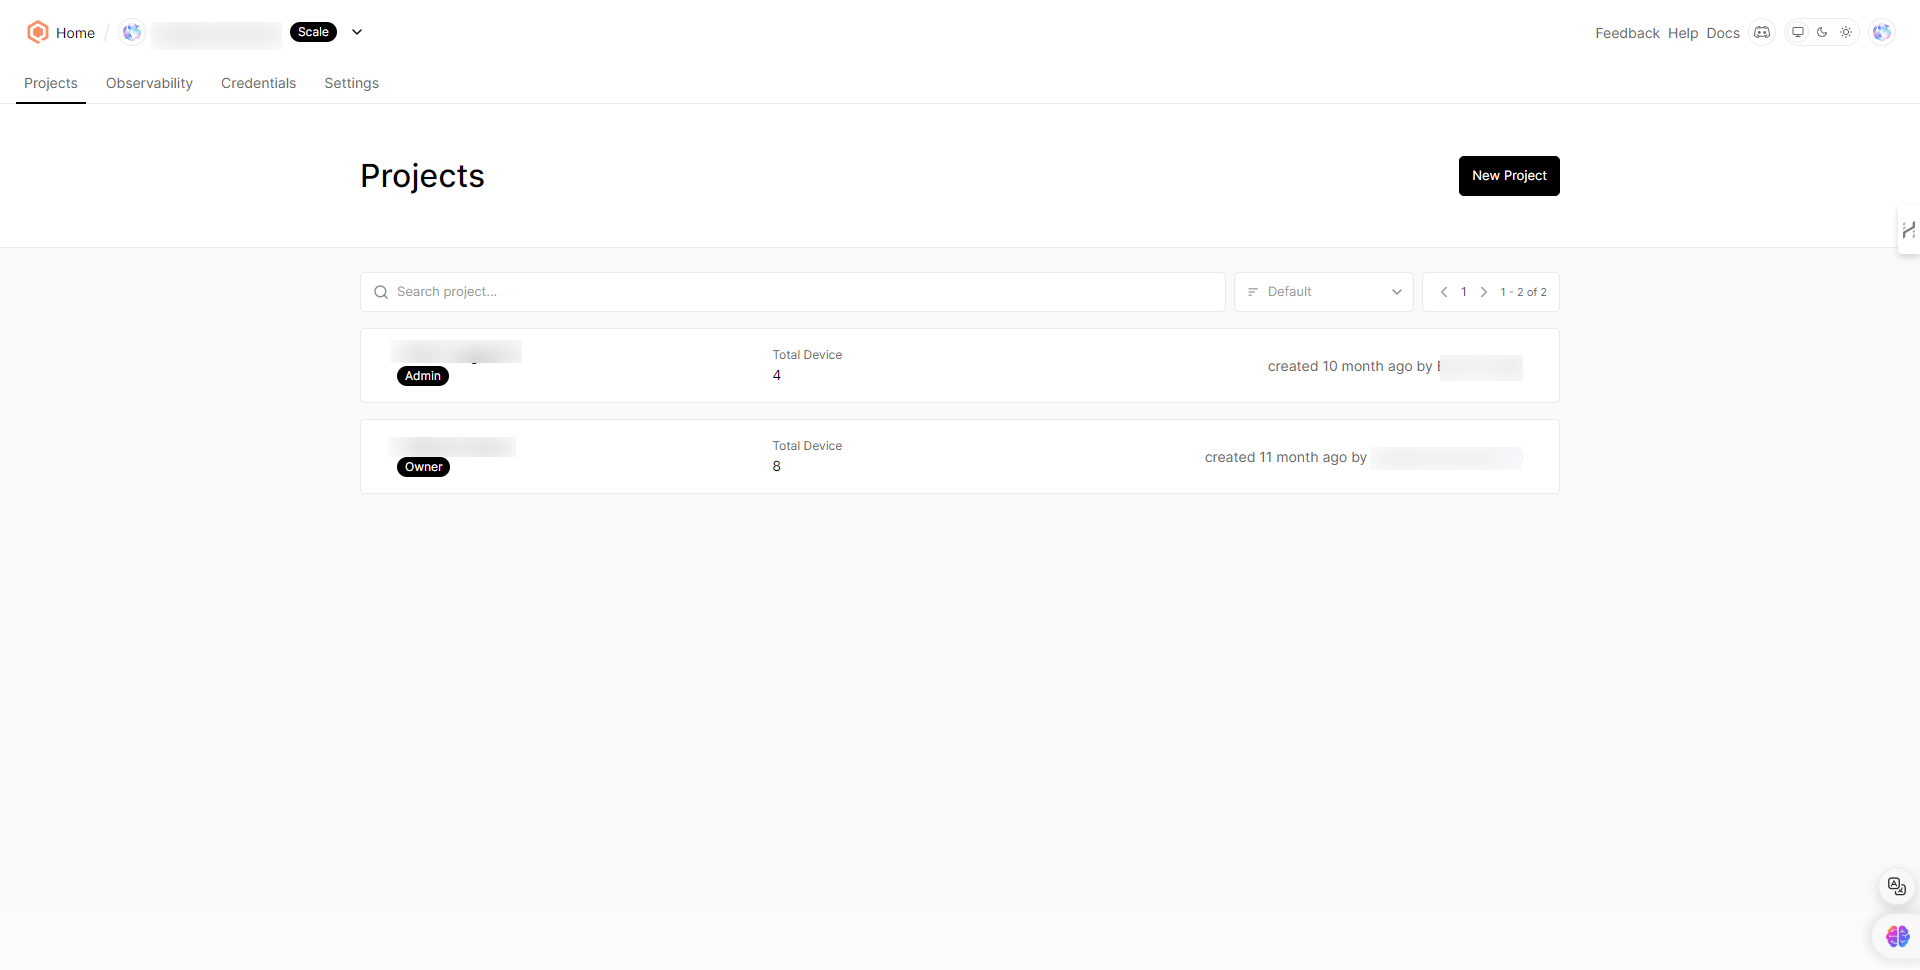 Figure 10 - Projects in Qubitro
 - On the project page, go to the “Settings” section to obtain the project ID. See Figure 11.
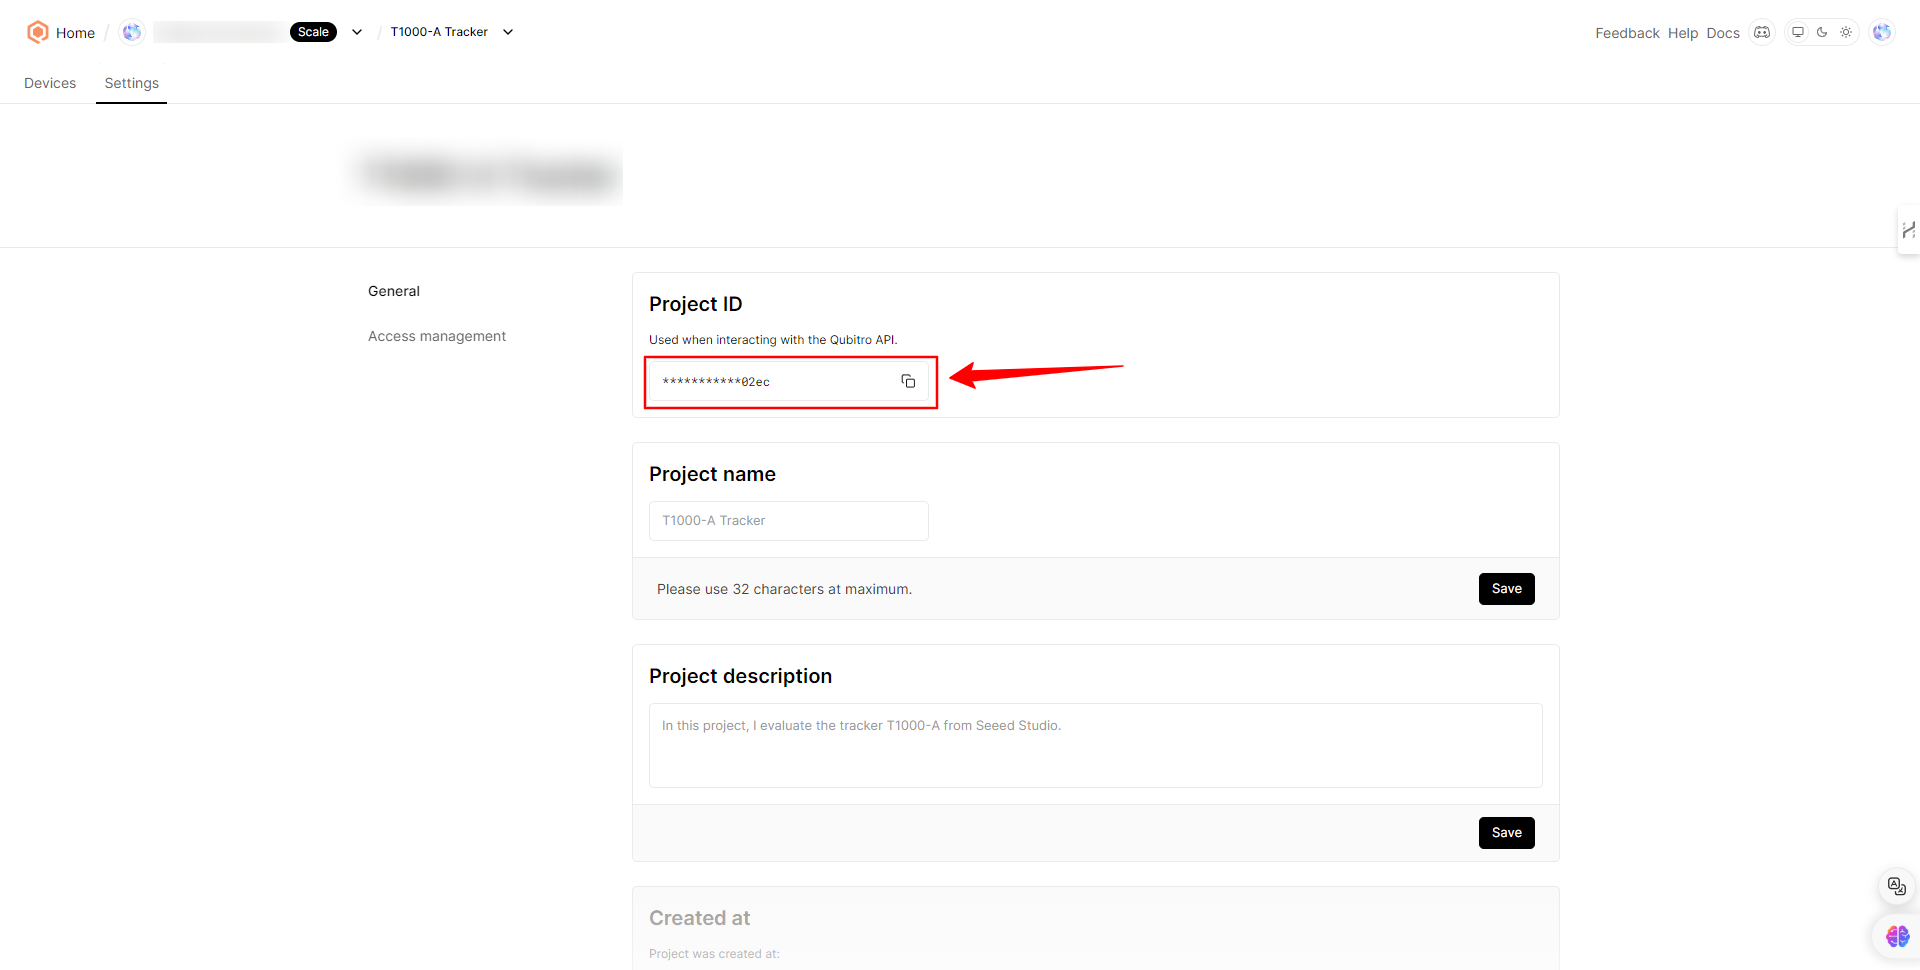 Figure 11 - Getting the Project ID
 - Now go to the “Devices” section and select the device you want to get data from. See Figure 12.
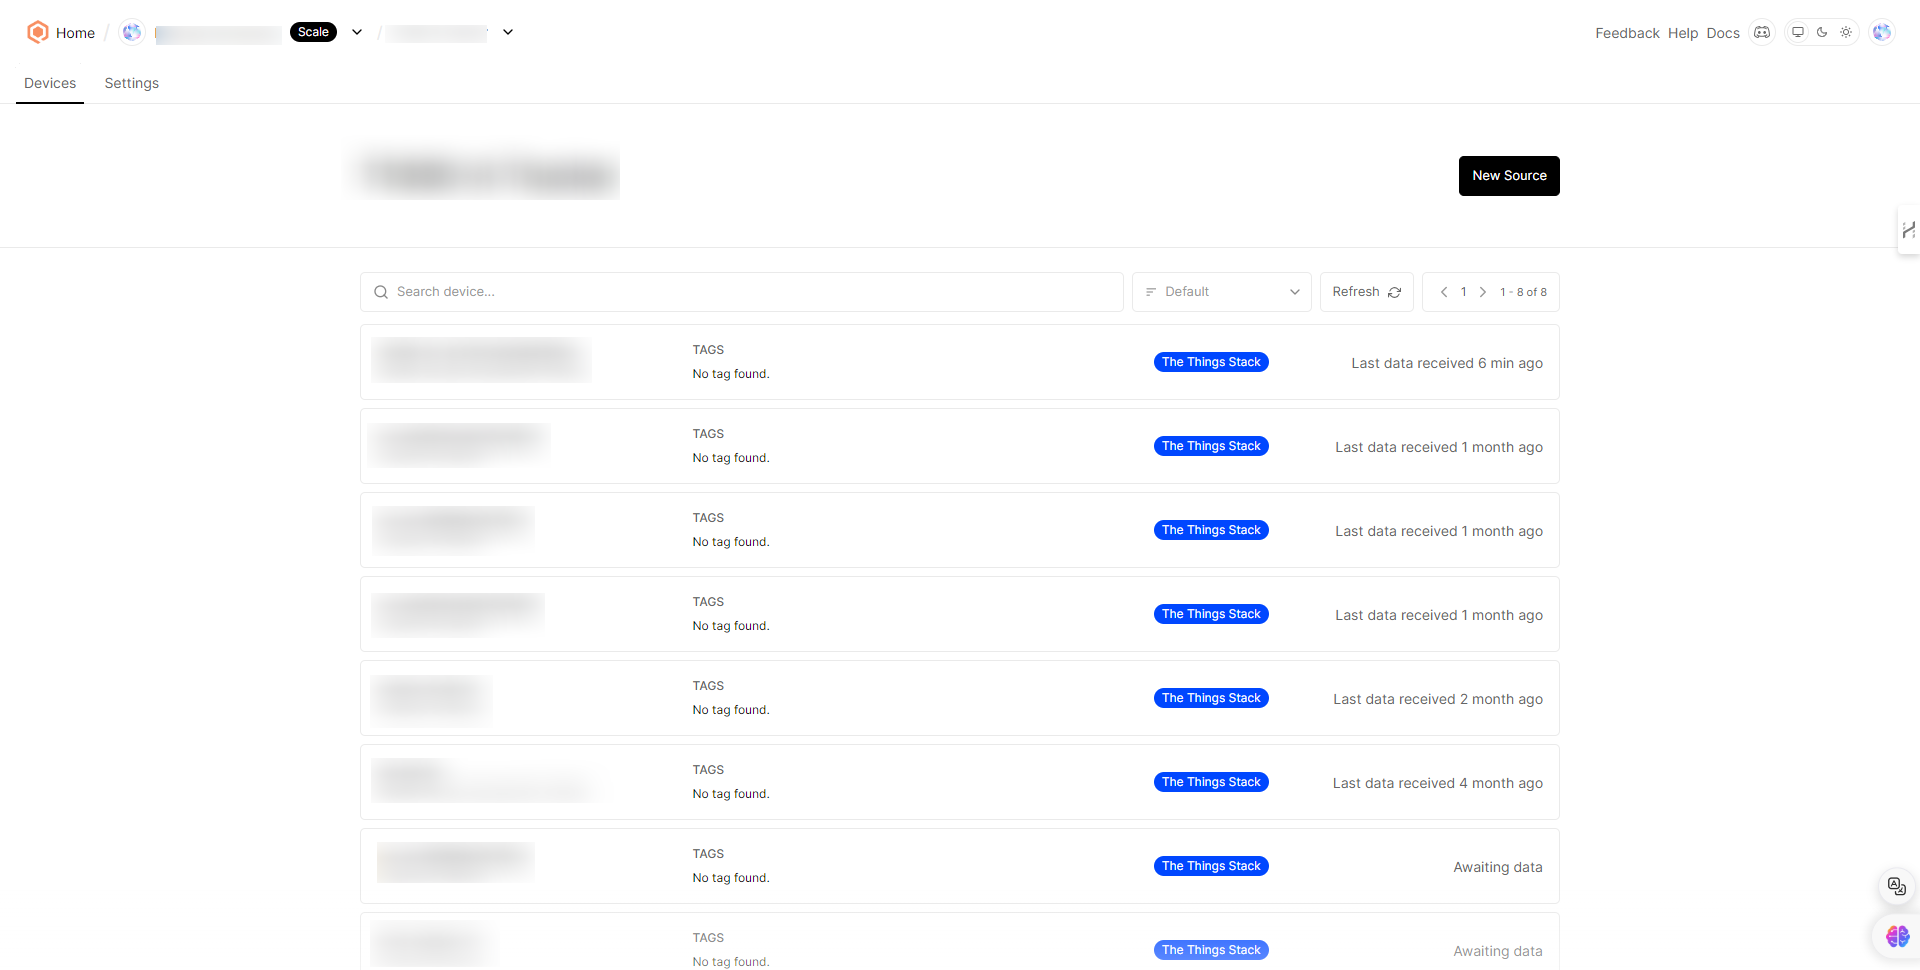 Figure 12 - Selecting the Device
 - On the device page, copy the device ID, as shown in Figure 13.
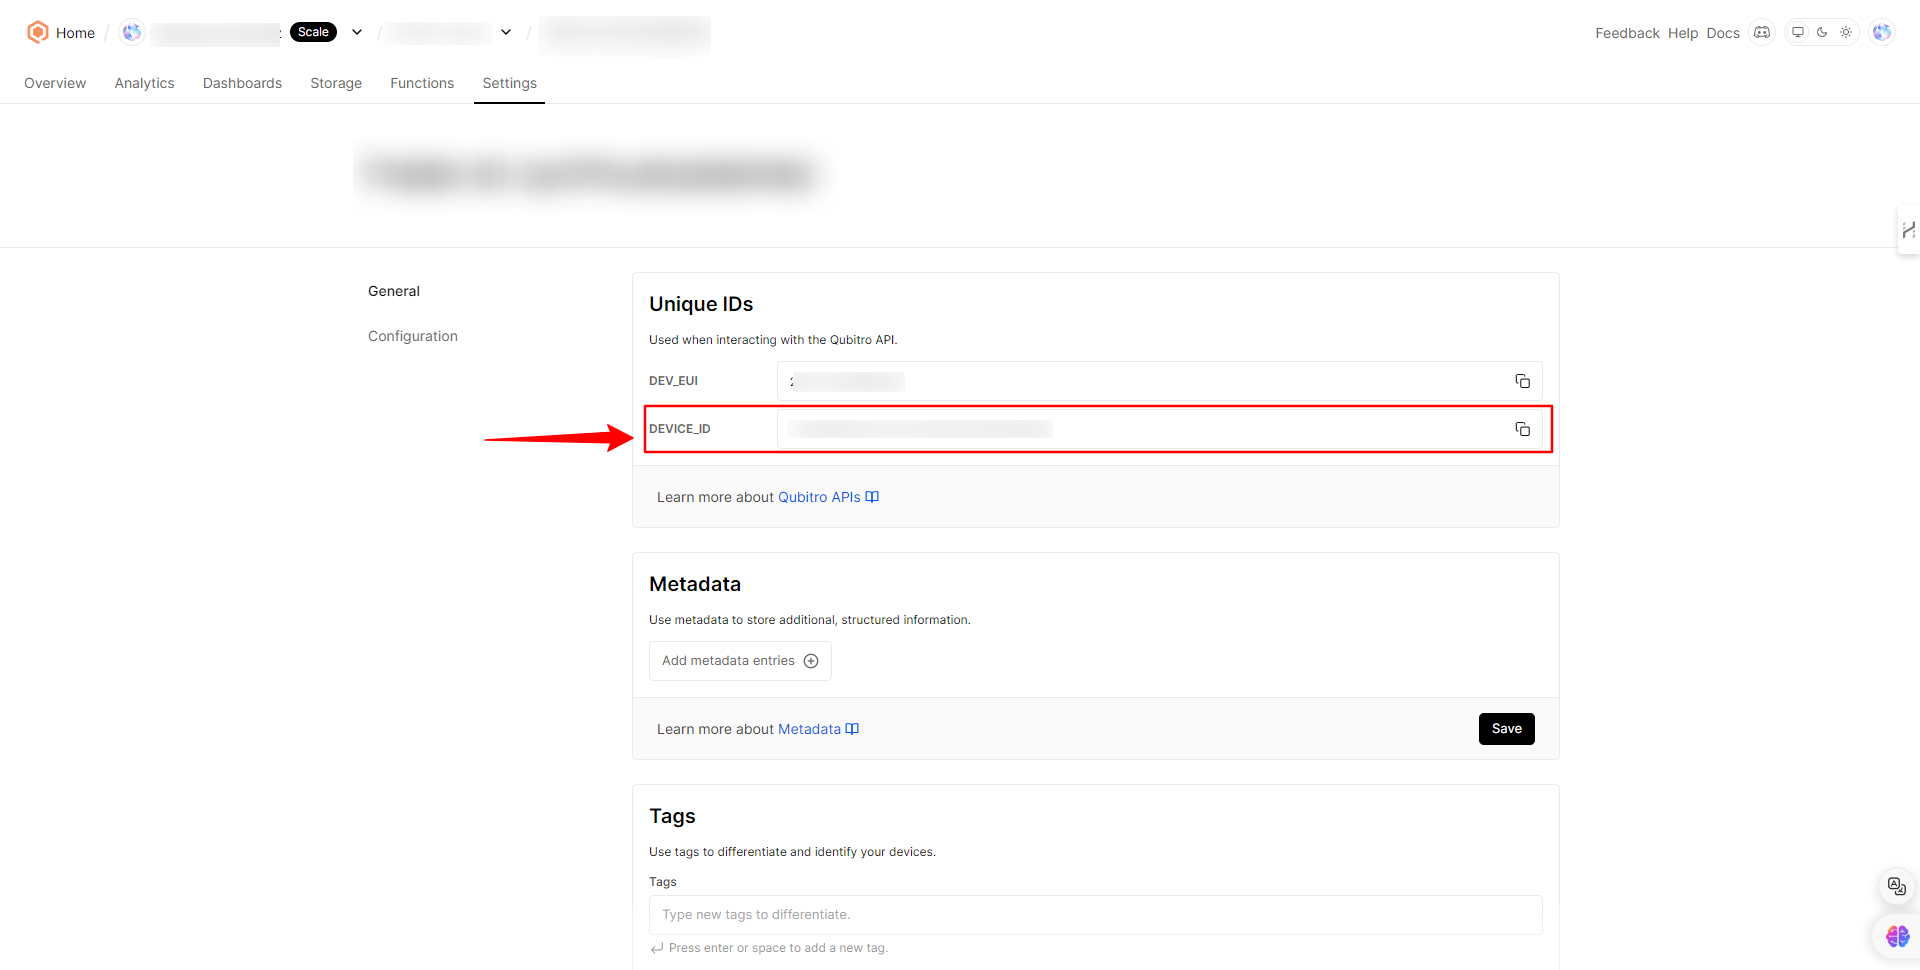 Figure 13 - Getting the Device ID
Now you have all you need to obtain device data using the Qubitro API. Let’s see how you can build the queries in Grafana.
In this example, we are using the T1000 tracker from Seeed Studio, which is registered in The Things Networks. However, all the topics covered in this tutorial are still useful for other devices.
Creating Queries and Showing Data
For obtaining data from Qubitro’s devices, you have to build some specific URLs. The URL structure is as follows:
https://api.qubitro.com/v2/projects/<project-ID>/devices/<device-ID>/data?page=1&limit=100&range=all
Replace <project-ID> and <device-ID> with the values you have obtained in the previous step. The page and limit parameters let you specify the amount of data you want to get.
Follow these steps for showing the data in a visualization panel:
- Go to Grafana and create a new dashboard by clicking on the “New dashboard” button. See Figure 14.
 Figure 14 - Creating a New Dashboard
 - Then create a new visualization by clicking on the big blue button. See Figure 15.
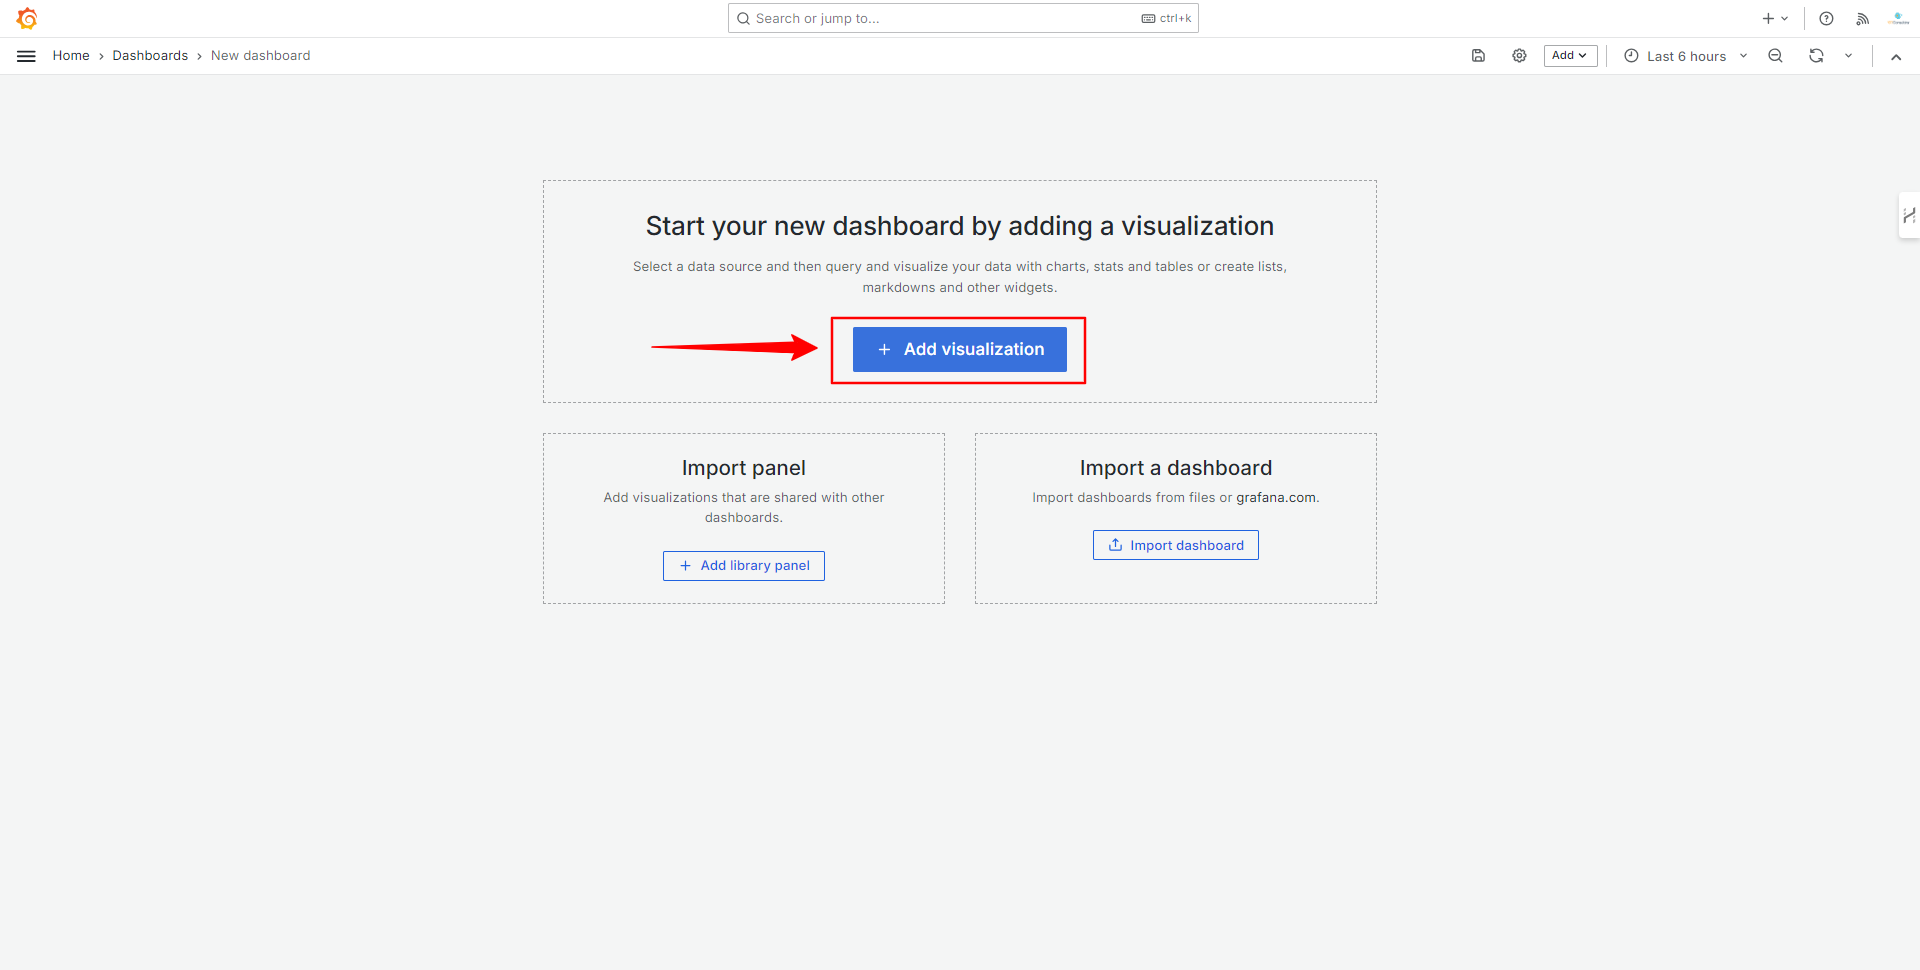 Figure 15 - Create a New Visualization
 - Next, select the data source you have created. See Figure 16.
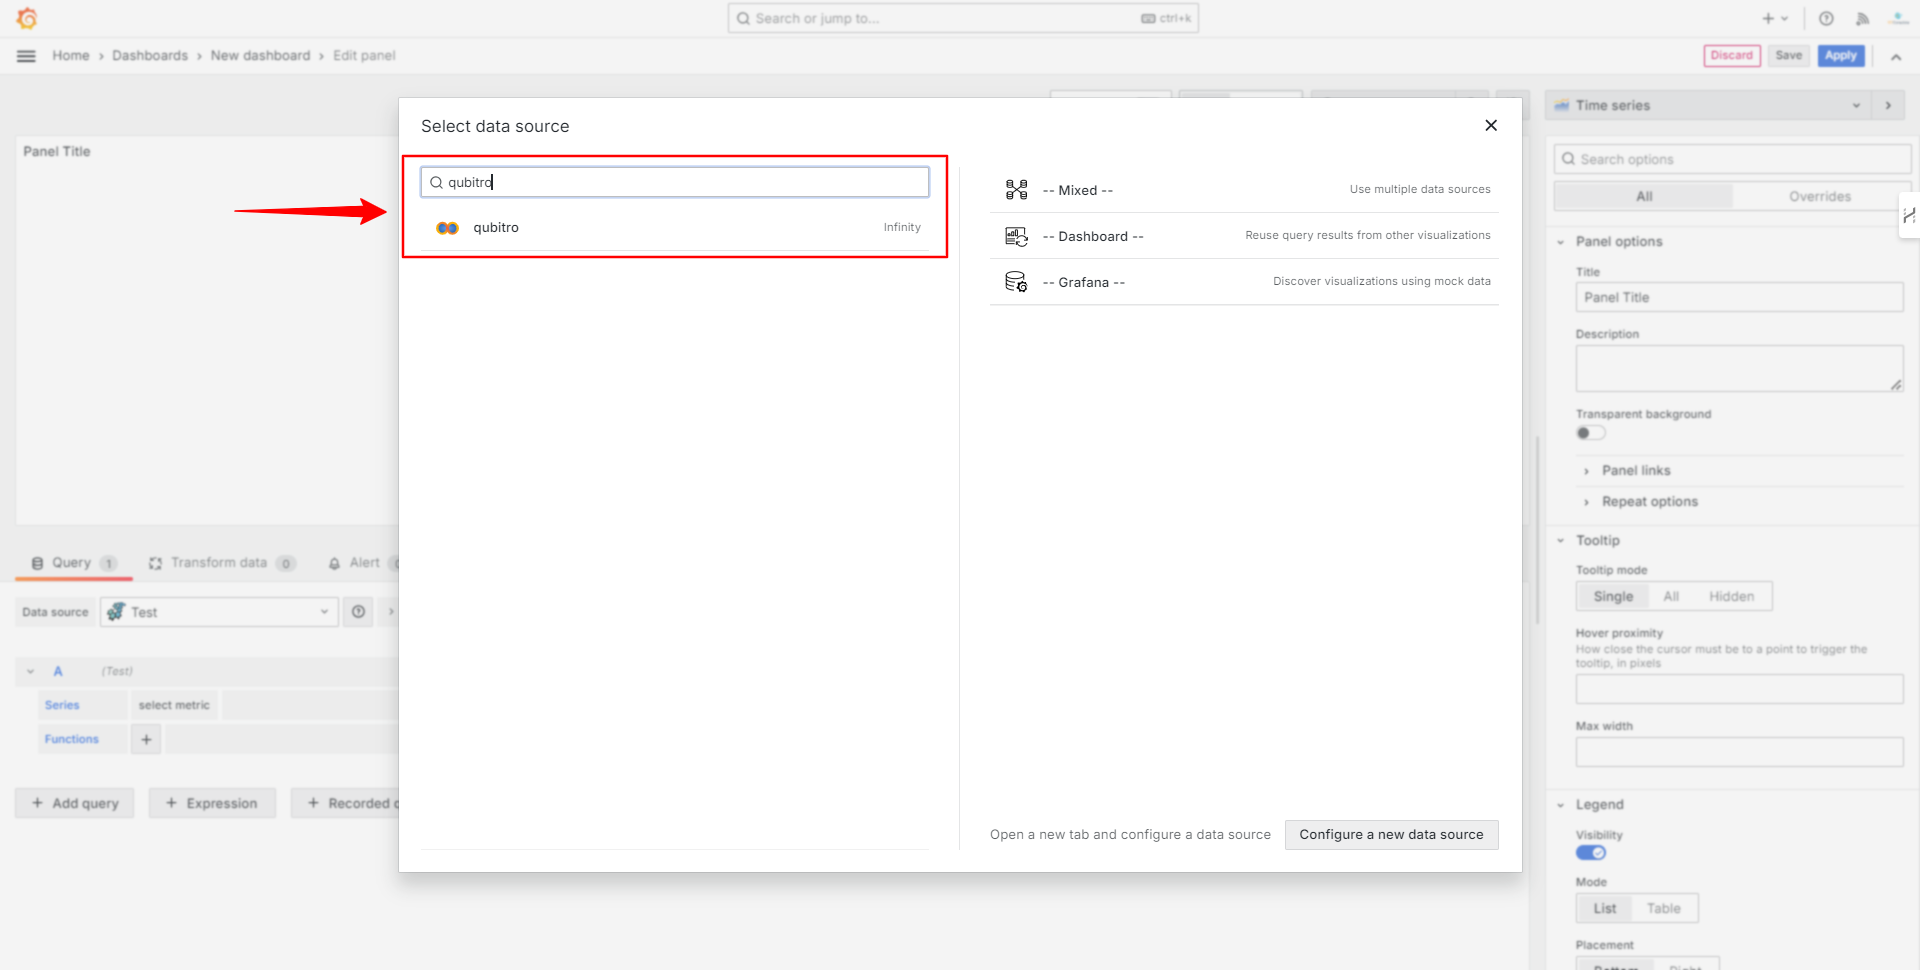 Figure 16 - Selecting the Data Source
 - Now, select a table as visualization and enter the URL you built in the previous section, as shown in Figure 17.
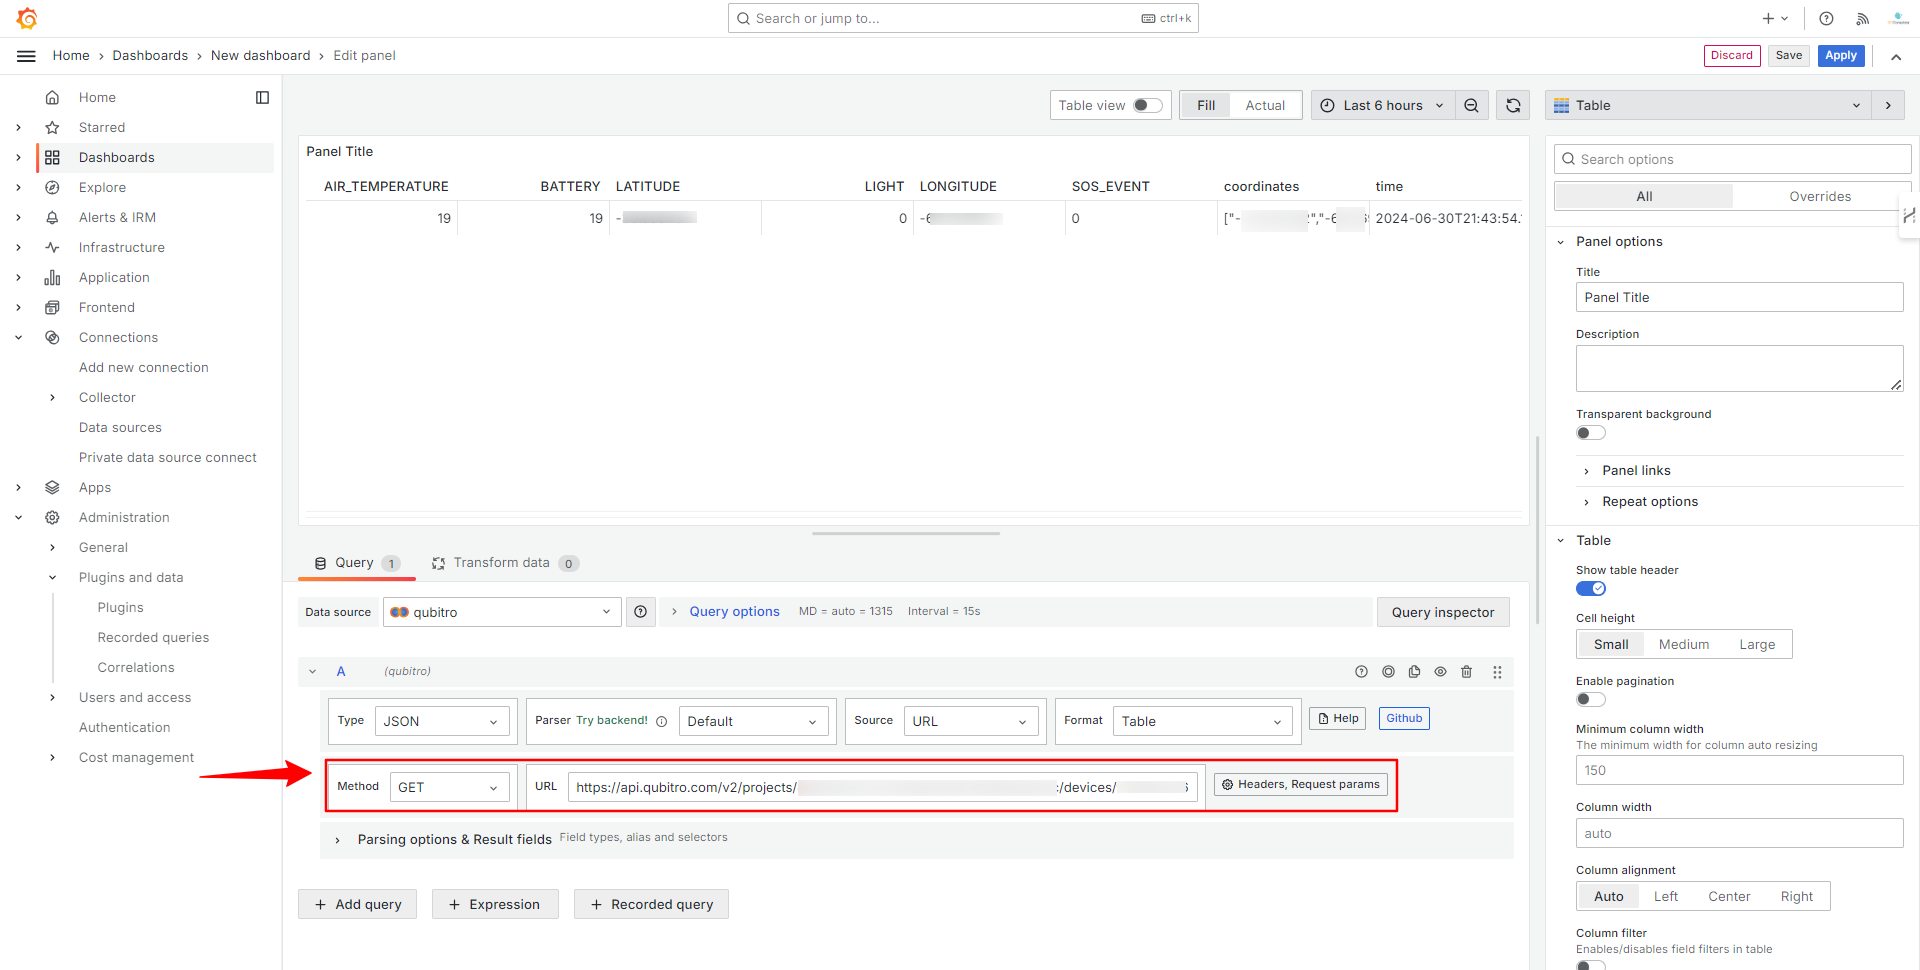 Figure 17 - See the Data on a Table
By looking at the table you can see the data that you are obtaining from Qubitro. Now, let's filter the data by selecting the desired columns. In this example, we are selecting the BATTERY and the time columns. After creating these columns you can switch the visualization to Time Series (see Figure 18 and Figure 19).
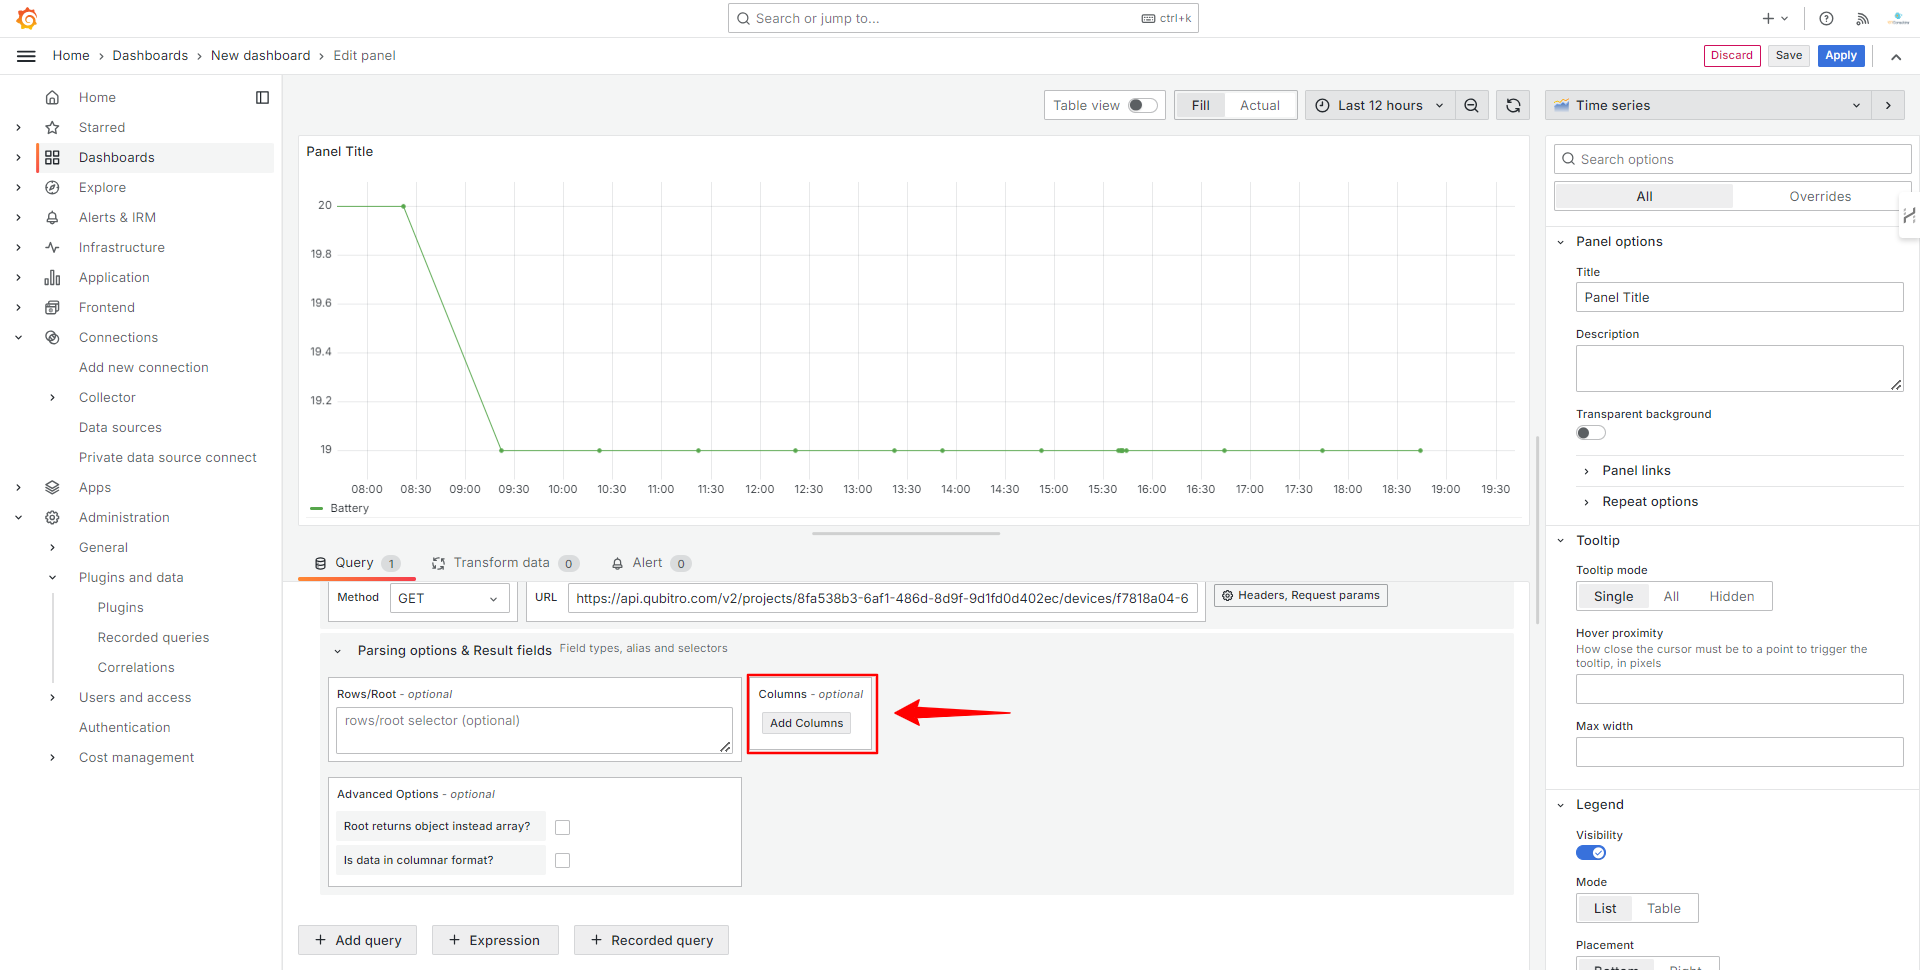 Figure 18 - Creating Columns
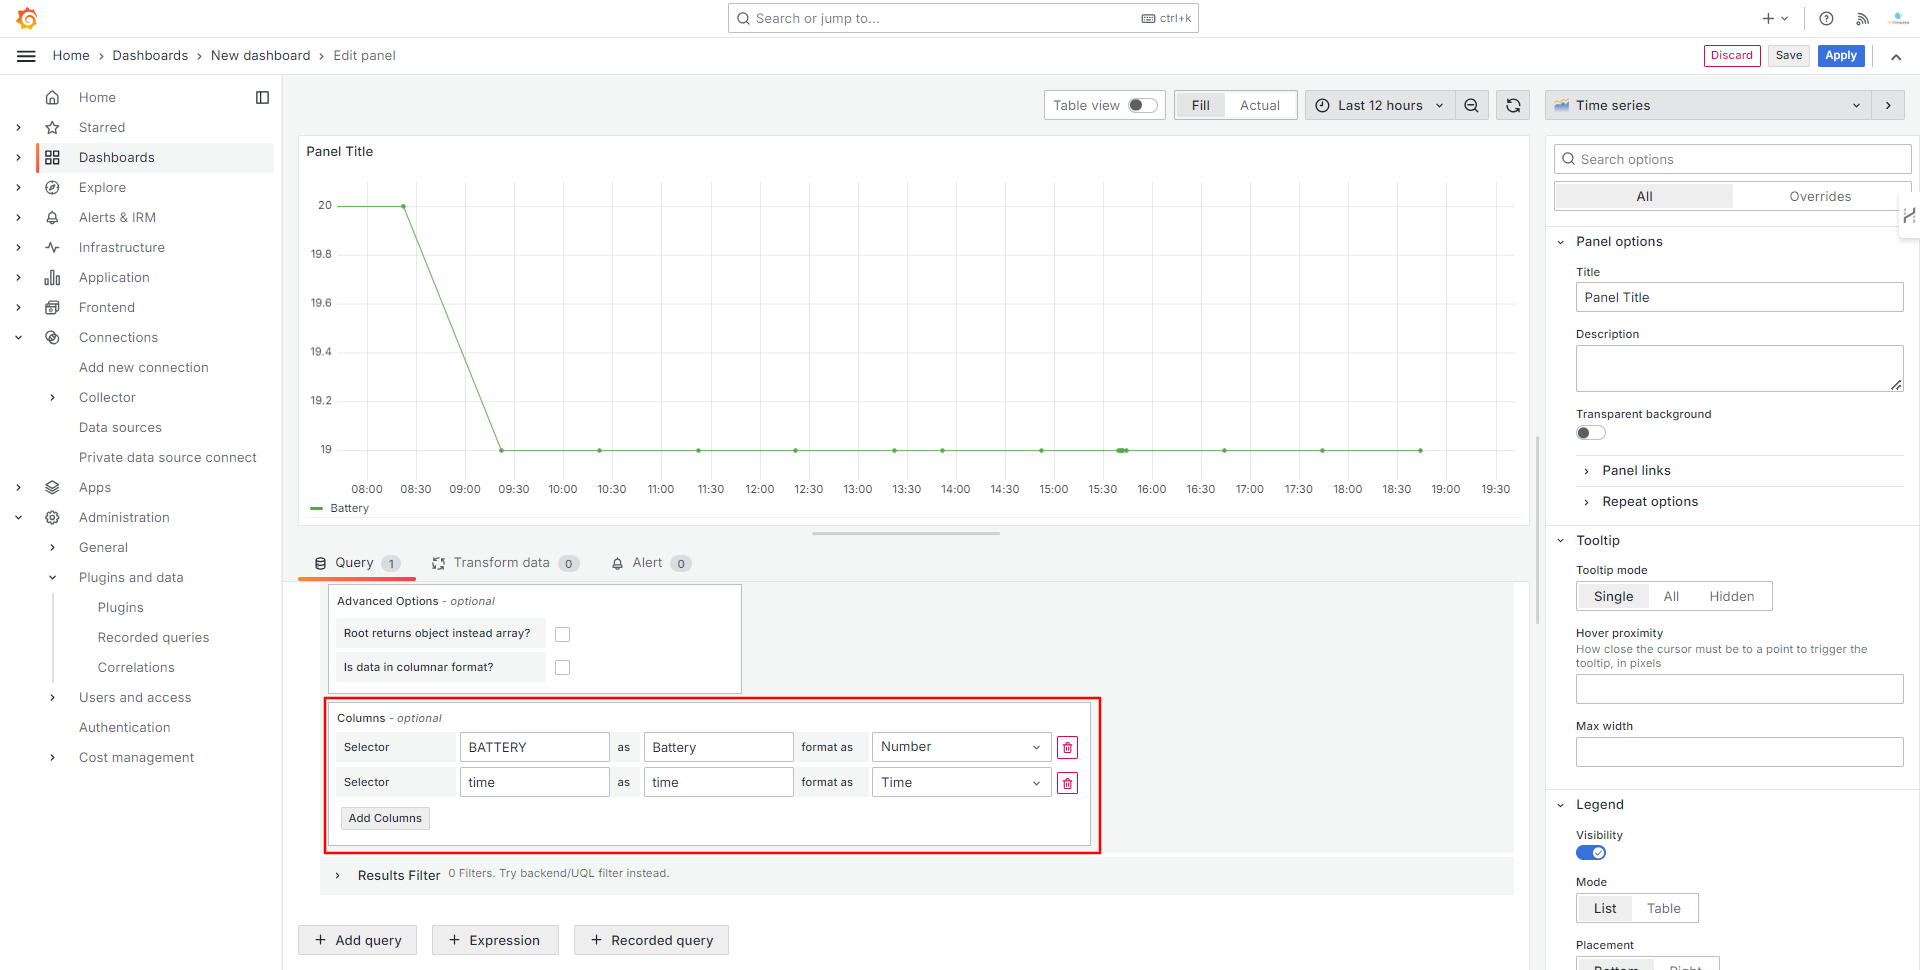 Figure 19 - Adding Columns
By repeating this procedure you can create new visualizations. You can see an example of a dashboard in Figure 20.
Figure 20 - Finished Dashboard in Grafana
Conclusions
In this article, we have seen how to build visualization dashboards in Grafana using data stored in Qubitro. Qubitro simplifies the device and data management processes, providing powerful functions to handle IoT data efficiently. By integrating Qubitro with Grafana, you can leverage the strengths of both platforms to create insightful and customizable dashboards for your IoT projects.